Search Journal-type in search term and press enter
Southwest Pulmonary and Critical Care Fellowships
In Memoriam

Sleep

(Click on title to be directed to posting , most recent listed first)

July 2023 Sleep Case of the Month: Fighting for a Good Night’s Sleep
Associations Between Insomnia and Obstructive Sleep Apnea with
   Nutritional Intake After Involuntary Job Loss
January 2023 Sleep Case of the Month: An Unexpected EEG Abnormality
July 2022 Sleep Case of the Month: A Sleepy Scout
Assessing Depression and Suicidality Among Recently Unemployed
   Persons with Obstructive Sleep Apnea and Socioeconomic
   Inequality
Impact of Recent Job Loss on Sleep, Energy Consumption and Diet
Long-term All-Cause Mortality Risk in Obstructive Sleep Apnea Using
   Hypopneas Defined by a ≥3 Percent Oxygen Desaturation or Arousal
The Association Between Obstructive Sleep Apnea Defined by 3 Percent
   Oxygen Desaturation or Arousal Definition and Self-Reported
Cardiovascular Disease in the Sleep Heart Health Study
Informe de políticas: Fatiga, sueño y salud del personal de enfermería, y 
   cómo garantizar la seguridad de los pacientes y el público
Sleep Tips for Shift Workers in the Time of Pandemic
Tips for Circadian Sleep Health While Working from Home
Impacto del Sueño y la Modalidad de Diálisis sobre la Calidad de Vida en
   una Población
The Effect of CPAP on HRQOL as Measured by the Quality of Well-Being
   Self-Administered Questionnaire (QWB-SA)
Declaración de posición: Reducir la fatiga asociada con la deficiencia de 
   sueño y las horas de trabajo en enfermeras
Impact of Sleep and Dialysis Mode on Quality of Life in a Mexican Population
Out of Center Sleep Testing in Ostensibly Healthy Middle Aged to Older
   Adults
Sleep Related Breathing Disorders and Neurally Mediated Syncope (SRBD
   and NMS)
Sleep Board Review Question: Restless Legs
Impact of Sleep Duration and Weekend Oversleep on Body Weight
   and Blood Pressure in Adolescents
Role of Spousal Involvement in Continuous Positive Airway Pressure
   (CPAP) Adherence in Patients with Obstructive Sleep Apnea (OSA)
The Impact of an Online Prematriculation Sleep Course (Sleep 101) on
   Sleep Knowledge and Behaviors in College Freshmen: A Pilot Study
Obstructive Sleep Apnea and Quality of Life: Comparison of the SAQLI,
   FOSQ, and SF-36 Questionnaires
Gender Differences in Real-Home Sleep of Young and Older Couples
Brief Review: Sleep Health and Safety for Transportation Workers
Lack of Impact of Mild Obstructive Sleep Apnea on Sleepiness, Mood and
   Quality of Life
Alpha Intrusion on Overnight Polysomnogram
Sleep Board Review Question: Insomnia in Obstructive Sleep Apnea
Long-Term Neurophysiologic Impact of Childhood Sleep Disordered 
   Breathing on Neurocognitive Performance
Sleep Board Review Question: Hyperarousal in Insomnia
Sleep Board Review Question: Epilepsy or Parasomnia?
Sleep Board Review Question: Nocturnal Hypoxemia in COPD
Sleep Board Review Questions: Medications and Their
   Adverse Effects
Sleep Board Review Questions: The Restless Sleeper
Obstructive Sleep Apnea and Cardiovascular Disease:
Back and Forward in Time Over the Last 25 Years
Sleep Board Review Questions: The Late Riser
Sleep Board Review Questions: CPAP Adherence in OSA
Sleep Board Review Questions: Sleep Disordered Breathing 
That Improves in REM
The Impact Of Sleep-Disordered Breathing On Body
   Mass Index (BMI): The Sleep Heart Health Study (SHHS)
Incidence and Remission of Parasomnias among Adolescent Children in the 
   Tucson Children’s Assessment of Sleep Apnea (TuCASA) Study 
A 45-Year Old Man with Excessive Daytime Somnolence, 
   and Witnessed Apnea at Altitude


The Southwest Journal of Pulmonary and Critical Care and Sleep publishes articles related to those who treat sleep disorders in sleep medicine from a variety of primary backgrounds, including pulmonology, neurology, psychiatry, psychology, otolaryngology, and dentistry. Manuscripts may be either basic or clinical original investigations or review articles. Potential authors of review articles are encouraged to contact the editors before submission, however, unsolicited review articles will be considered.

-------------------------------------------------------------------------------------

Tuesday
Nov162021

Impact of Recent Job Loss on Sleep, Energy Consumption and Diet 

Salma Batool-Anwar, MD, MPH

Candace Mayer

Patricia L. Haynes, PhD

Yilin Liu

Cynthia A. Thomson, PhD, RDN

Stuart F. Quan, MD

Division of Sleep and Circadian Disorders, Brigham and Women’s Hospital, Harvard Medical School, Boston, MA; Mel and Enid Zuckerman College of Public Health, University of Arizona, Tucson, AZ

Abstract 

To examine how sleep quality and sleep duration affect caloric intake among those experiencing involuntary job loss.

Methods

Adequate sleep and self-reported dietary recall data from the Assessing Daily Activity Patterns through Occupational Transitions (ADAPT) study was analyzed. Primary sleep indices used were total sleep time, time spent in bed after final awakening, and sleep quality as measured by the Daily Sleep Diary (DSD). Mean Energy consumption (MEC) was the primary nutritional index. Secondary indices included diet quality using the Health Eating Index 2015 (HEI), and self-reported intake of protein, carbohydrates and fats.

Results

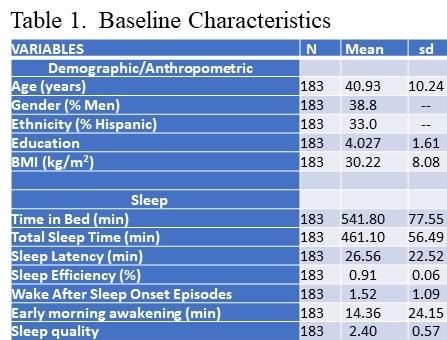
The study participants were comprised mainly of women (61%) and non-Hispanic white. The participants had at least 2 years of college education and mean body mass index of 30.2±8.08 (kg/m 2 (). The average time in bed was 541.8 (9 hrs) ±77.55 minutes and total sleep time was 461.1 (7.7 hrs) ±56.49 minutes. Mean sleep efficiency was 91±6%, self-reported sleep quality was 2.40±0.57 (0-4 scale, 4 = very good), and minutes earlier than planned morning awakening were 14.36±24.15. Mean HEI score was 47.41±10.92. Although the MEC was below national average for both men and women, male sex was associated with higher MEC. In a fully adjusted model sleep quality was positively associated with MEC.

Conclusion

Daily overall assessments of sleep quality among recently unemployed persons were positively associated with mean energy consumption. Additionally, the diet quality of unemployed persons was found to unhealthier than the average American and consistent with the relationship between poor socioeconomic status and lower diet quality.

Abbreviations

  • SES: Socioeconomic status
  • ADAPT: Assessing Daily Activity Patterns through Occupational Transitions
  • UI: unemployment insurance
  • MEC: mean energy consumption
  • BMI: body mass index
  • USDA: United States Department of Agriculture
  • HEI: Healthy Eating Index
  • DSD: Daily Sleep Diary
  • TST: total sleep time
  • EMA: earlier than desired morning awakening
  • SD: Standard Deviation
  • TIB: time in bed

Introduction

Obesity is a major public health concern; 38.3% of women and 34.3% of men in the United States are obese. It is not only the result of low physical activity and overconsumption of high energy yielding foods, socioeconomic status also plays a major role (1,2). Obesity disproportionately affects people of lower socioeconomic status (SES) in part because their limited financial resources result in consumption of calorically dense unhealthy food. This contributes to the risk of developing obesity (3).

A major determinant of SES is employment status. Unemployment is one indicator of a reduced SES and is associated with higher levels of stress. Unemployment includes involuntary job loss which is an important disruptive life event. It can cause additional unanticipated psychological and economic stress with the former afflicting women disproportionately (4). Involuntary job loss is positively associated with greater symptoms of depression, disruptions in daily routine changes and poor sleep quality (5). Unemployment has been shown to be positively associated with obesity (6,7). In one study, women were more likely to be diagnosed with obesity after involuntary job loss (8).

Sleep is another factor that affects obesity risk. Lower sleep quality and reductions in sleep duration have been shown to increase food intake resulting in becoming overweight or obese (9). Sleep deficiency can change the secretory pattern of leptin and ghrelin leading to hunger and a craving for calorically dense food (10,11).

There are no prior studies that have investigated the impact of whether sleep quality or sleep duration influences caloric consumption in those that have experienced involuntary job loss. The Assessing Daily Activity Patterns through Occupational Transitions (ADAPT) Study is an ongoing longitudinal cohort study of individuals who have suffered involuntary job loss. We analyzed cross sectional data from the baseline assessment of the ADAPT study and hypothesized that disrupted, short sleep would be associated with increased energy intake among these individuals.

Methods

Participants

Study participants were part of the on-going ADAPT Study, an 18-month longitudinal study examining changes in sleep, social rhythms, and obesity following an involuntary job loss (12). The study protocol and recruitment strategy have been described in detail previously. Briefly, all individuals who applied for unemployment insurance (UI) in the greater Tucson, Arizona and surrounding areas between October 2015 and December 2018 received study recruitment flyers within their UI intake packets. Interested individuals contacted study staff and completed phone screens assessing exclusion criteria; potentially eligible individuals were then scheduled for in-person screening visits. Individuals were eligible if they had experienced an involuntary job loss within 90 days of study enrollment, had been with their employer for at least six months, were currently employed less than 5 hours per week and did not complete any night shift work within the last 30 days. During the in-person screening, participants provided written informed consent, as well as information about their demographics, employment and medical history. They also were screened for homelessness, existing physiological and mental health conditions, substance abuse, and major sleep diagnoses which could interfere with social rhythms and sleep patterns. Those who passed screening completed validated mental health and sleep diagnostic interviews. An overnight at-home screening for sleep apnea was performed utilizing the ApneaLink PlusTM (ResMed, San Diego, CA) to exclude moderate sleep apnea as a cause of sleep disruption.

Data used in this analysis originated from the study’s baseline visit. Of the 446 adults who provided written consent, 191 participants met eligibility criteria and completed a baseline assessment visit, including an at-home data collection period lasting two weeks. Participants were considered for the current analysis if there was an acceptable assessment of sleep and diet on their sleep diaries and dietary recalls respectively for analysis. However, 8 participants were excluded as outliers because their mean energy consumption (MEC) was significantly less than commonly reported norms (13,14). Descriptive statistics for the study sample are reported in Table 1.

Click here to view Table 1 enlarged in a new window

Measures

Demographic and Anthropometric

Age, ethnicity and biological sex were collected during the initial interview. Height and weight were measured to calculate the body mass index (kg/m2,BMI).

Diet Assessment

During the two-week, at-home baseline data collection period, participants completed up to three 24-hour dietary recalls administered by trained diet assessors at the Behavioral Measurements and Interventions Shared Resource of the University of Arizona Cancer Center utilizing the gold-standard USDA Multi-pass Dietary recall and the Nutrient Database System of the University of Minnesota for nutrient analysis (15,16). These interviews were supported by the Remote Food Photography Method, in which participants took pictures of all food and beverages prior to consumption, as well as after they had finished eating and drinking (17). Photos were used to review recall as a final verification of the multi-pass data. The diet recalls provided information on the types and quantity of food, including energy and nutrient values. At least 3 dietary recalls were completed by 172 participants (95.6% of the cohort). The primary index for this analysis was MEC (kcal). Secondary indices included diet quality estimated using the Health Eating Index 2015 (HEI) using standardized approaches to score, and self-reported intake of protein, carbohydrates and fats (18).

Sleep Measures

Sleep variables of interest were measured using the valid and reliable Daily Sleep Diary (DSD), the recommended subjective sleep assessment instrument of the insomnia research consensus panel (19). Upon wakening from their sleep, participants completed the DSD via mobile application. The DSD was completed at least 15 times by 170 participants with only 3 participants completing less than 4 days of diary data. The primary indices of interest were total sleep time (TST) and minutes earlier than desired morning awakening (EMA) as indices of sleep duration. Additionally, sleep onset latency, sleep efficiency, number of wakes after sleep onset episodes and time in bed were calculated. Self-reported sleep quality was assessed using the 5 point Likert scale incorporated into the DSD (19).

Statistical Analysis

For baseline characteristics, mean (SD) for continuous variables and percentages for categorical variables were calculated. After removing the extreme outliers we fitted linear regression models to predict MEC and HEI with sleep indices as predictors. Finally, five models were performed in multiple regression analysis. These models were adjusted for age, gender, education level, and body mass index. The results from regression analysis are presented as β-coefficients (standardized/unstandardized) with p values. In Model 1 we included energy consumption as predicted by total sleep time. In Model 2 we included energy consumption as predicted by time in bed. In Model 3, we included energy consumption as predicted by early morning awakenings. In Model 4, we included energy consumption as predicted by sleep quality. In our final Model 5, we included energy consumption as predicted by all sleep indices combined from other models. The level of statistical significance for all models was set at 0.05. To test the robustness of the analysis, we conducted a sensitivity analysis by excluding 3 participants who did not completed the DSD at least four times. All statistical analyses were done using STATA version 11 (StataCorp, LLC, College Station, TX, USA).

Results

The demographic and anthropometric characteristics of the study population are described in Table 1 (see above). Most participants were women (61%) and non-Hispanic white with the remainder primarily Hispanic. On average, study participants had at least 2 years of college education and had a mean body mass index of 30.22 (kg/m2).

As shown on Table 1, average time in bed (TIB) and total sleep time (TST) were 541.8 minutes (9.0 hrs) ±77.55 and 461.1 minutes (7.6 hrs) ±56.49 minutes respectively. However, the range was large with minimums of (5.7 hrs for TIB/ 5.2 hrs for TST) and maximums of (15.2 hrs for TIB and 10.1 for TST) respectively. Mean sleep efficiency was within normal limits (91%). There generally were few episodes of wake after sleep onset, and only a small amount of time (14 min) spent awake in the morning (EMA). Self-reported sleep quality was 2.39 using a 5 point Likert scale from 0 to 4 representing very poor, poor, good and very good sleep respectively.

Table 2 shows the MEC as well as the intake of protein, carbohydrates, fats, fruits and vegetables.

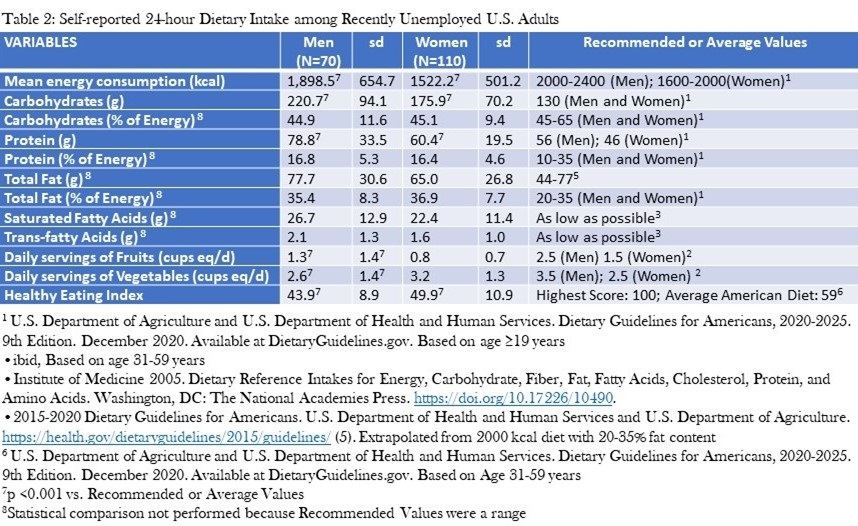
Click here to view Table 2 enlarged in a new window

Normative values for men and women in the United States are provided for comparison. The MEC was below averages for national data in both men and women (20-21). Absolute intake of protein and carbohydrates was higher than recommended levels, but was within recommended levels as a percent of energy consumption. Absolute intake of total fat was at the higher limit of recommended levels, but exceeded them as a percent of energy consumption. Consumption of fruit and vegetables were below recommendations. The HEI also was markedly reduced (Men: 43.9±8.9; Women: 49.9±10.9 vs. 59 for average American diet) (21).

Univariate regression models examining the impact of age, gender, education and BMI on MEC are presented in Table 3.

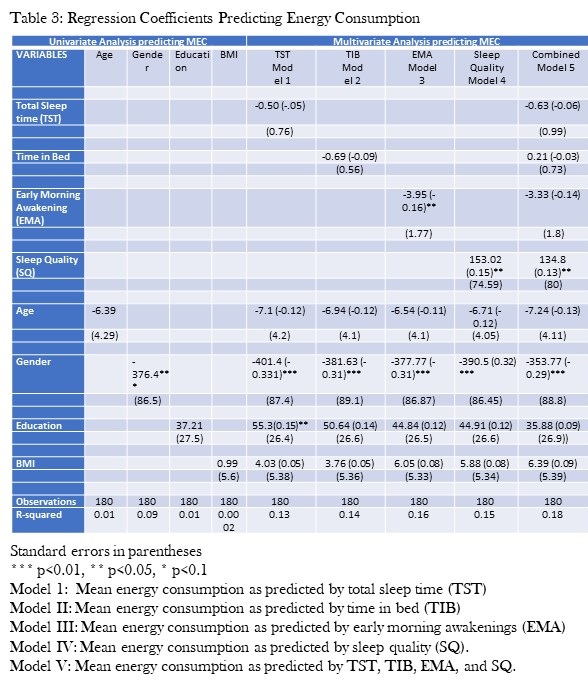
Click here to view Table 3 enlarged in a new window

Male gender was associated with higher MEC but age, education and BMI were not. Univariate regression models assessing the effect of the various sleep variables demonstrated that only TST, TIB, EMA and sleep quality significantly affected MEC (data not shown). Therefore, each of these factors were included by themselves in multivariate regression models that also incorporated age, gender, education and BMI (Table 3). Sleep quality was positively associated with MEC while EMA was negatively associated. There was no significant relationship between MEC and TST. A final model integrating TST, TIB, EMA and sleep quality showed that only sleep quality was associated with higher MEC, but EMA had no significant impact. In a sensitivity analysis, we excluded the participants who had not completed the DSD at least 4 times. However, this did not materially change the results.

Regression models were calculated to examine the impact of sleep on dietary components and the HEI. None were shown to be significant (data not shown).

Discussion

In this study of persons who recently involuntarily became unemployed, we did not find any significant associations between their MEC and various parameters related to sleep duration and sleep fragmentation. However, overall positive subjective sleep quality was associated with greater MEC. Individual dietary components and the HEI also were not related to sleep duration or fragmentation but did indicate that the diet of involuntarily unemployed persons is of lower quality, based on HEI 2015 scoring, than average for US adults (18,21).

In most, but not all studies, sleep duration has been shown to be inversely associated with MEC. In contradistinction, our analyses did not find any significant relationship with respect to either TST or TIB. Although minutes spent awake in the morning before getting out of bed (EMA) was inversely associated with MEC, this association was borderline and not significant in a fully adjusted model. Similarly, sleep efficiency and number of wakes after sleep onset episodes were not related to MEC. Explanations for increased MEC with restricted sleep duration or fragmentation include but are not limited to changes in the relative levels of satiety and hunger hormones, greater available time to eat, altered timing of meals and hedonic feeding (22). Our data suggest that in this population, the impact of these factors is not sufficient enough to alter MEC. Importantly, a large body of evidence suggests under-reporting of dietary intake is associated with obesity, female sex and lower education and may be more common among Hispanics who accounted for 33% of our sample (23,24). Systematic under-reporting of intake may have undermined our ability to capture significant associations between energy intake and sleep in this study.

Subjective sleep quality was positively correlated with MEC; better sleep quality was associated with higher levels of MEC. The direction of this finding is inconsistent with previous studies that have noted better sleep quality is associated with more nutritious diets and less obesity (25,26). The lack of agreement between daily subjective overall sleep quality, and specific individual subjective sleep quality metrics as well as objective sleep quality instruments (e.g., actigraphy) has been reported previously. In a recent study of sleep quality in older adults, the specific measures assessed by the DSD used in this study was compared to the Pittsburgh Sleep Quality Index as well as subjective sleep quality recorded in the diary. Little agreement was observed among all three measures (27). Furthermore, subjective estimates of sleep or alertness have been shown to be a poor predictor of other aspects of human behavior and performance (28,29). Our findings provide a unique perspective on the use of the DSD, an instrument that is considered a gold-standard for the assessment of sleep in persons with insomnia subject to less retrospective recall bias that global estimates of sleep quality.

We observed that the diet of recently unemployed persons differed in many categories from recommendations and guidelines made by the Institute of Medicine and the US Department of Agriculture. Additionally, the HEI of the average American is already suboptimal at 59 and mean scores appear to be even lower in our sample of unemployed individuals. Food cost is inversely correlated with diet quality and is one factor that contributes to the higher prevalence of unhealthy diets in those with lower socioeconomic status (30). Our findings extend these previous observations by demonstrating the adverse economic impact of recent job loss is associated with worse diet quality.

In conclusion, in recently unemployed persons, subjective diary assessments of sleep quality were not associated with mean energy consumption. However, the diet quality of unemployed persons was found to unhealthier than the average American and consistent with the relationship between poor socioeconomic status and lower diet quality.

Acknowledgements

The authors would like to thank the staff and participants of the Assessing Daily Activity Patterns Through Occupational Transitions Study (ADAPT). The authors would like to gratefully acknowledge the assistance of the Arizona Department of Economic Security in study recruitment, and the support of the University of Arizona Collaboratory for Metabolic Disease Prevention and Treatment.

The ADAPT study was supported by the US National Heart, Lung, and Blood Institute (HL117995).

References

  1. Ogden CL, Carroll MD, Fryar CD, Flegal KM. Prevalence of Obesity Among Adults and Youth: United States, 2011-2014. NCHS Data Brief. 2015 Nov;(219):1-8. [PubMed]
  2. Bhupathiraju SN, Hu FB. Epidemiology of Obesity and Diabetes and Their Cardiovascular Complications. Circ Res. 2016 May 27;118(11):1723-35.[CrossRef] [PubMed]
  3. Cheon BK, Hong YY. Mere experience of low subjective socioeconomic status stimulates appetite and food intake. Proc Natl Acad Sci U S A. 2017 Jan 3;114(1):72-77. [CrossRef] [PubMed]
  4. Baik K, Hosseini M, Priesmeyer HR. Correlates of psychological distress in involuntary job loss. Psychol Rep. 1989 Dec;65(3 Pt 2):1227-33. [CrossRef] [PubMed]
  5. Berchick ER, Gallo WT, Maralani V, Kasl SV. Inequality and the association between involuntary job loss and depressive symptoms. Soc Sci Med. 2012 Nov;75(10):1891-4. [CrossRef] [PubMed]
  6. Akil L, Ahmad HA. Effects of socioeconomic factors on obesity rates in four southern states and Colorado. Ethn Dis. 2011 Winter;21(1):58-62. [PubMed]
  7. Latif E. The impact of macroeconomic conditions on obesity in Canada. Health Econ. 2014 Jun;23(6):751-9. [CrossRef] [PubMed]
  8. Schröder M. Jobless now, sick later? Investigating the long-term consequences of involuntary job loss on health. Adv Life Course Res. 2013 Mar;18(1):5-15. [CrossRef] [PubMed]
  9. Parvaneh K, Poh, B., Hajifaraji, M., & Ismail, M. Less Sleep Duration and Poor Sleep Quality Lead to Obesity. Proceedings of the Nutrition Society 2016;75(OCE1).
  10. Spiegel K, Leproult R, L'hermite-Balériaux M, Copinschi G, Penev PD, Van Cauter E. Leptin levels are dependent on sleep duration: relationships with sympathovagal balance, carbohydrate regulation, cortisol, and thyrotropin. J Clin Endocrinol Metab. 2004 Nov;89(11):5762-71. [CrossRef] [PubMed]
  11. Van Cauter E, Leproult R, Plat L. Age-related changes in slow wave sleep and REM sleep and relationship with growth hormone and cortisol levels in healthy men. JAMA. 2000 Aug 16;284(7):861-8. [CrossRef] [PubMed]
  12. Haynes PL, Silva GE, Howe GW, et al. Longitudinal assessment of daily activity patterns on weight change after involuntary job loss: the ADAPT study protocol. BMC Public Health. 2017 Oct 10;17(1):793. [CrossRef] [PubMed]
  13. Vasquez MM, Goodwin JL, Drescher AA, Smith TW, Quan SF. Associations of dietary intake and physical activity with sleep disordered breathing in the Apnea Positive Pressure Long-Term Efficacy Study (APPLES). J Clin Sleep Med. 2008 Oct 15;4(5):411-8. [PubMed]
  14. Rock CL, Thornquist MD, Kristal AR, et al. Demographic, dietary and lifestyle factors differentially explain variability in serum carotenoids and fat-soluble vitamins: baseline results from the sentinel site of the Olestra Post-Marketing Surveillance Study. J Nutr. 1999 Apr;129(4):855-64. [CrossRef] [PubMed]
  15. Subar AF, Thompson FE, Potischman N, Forsyth BH, Buday R, Richards D, McNutt S, Hull SG, Guenther PM, Schatzkin A, Baranowski T. Formative research of a quick list for an automated self-administered 24-hour dietary recall. J Am Diet Assoc. 2007 Jun;107(6):1002-7. [CrossRef] [PubMed]
  16. Feskanich D, Sielaff BH, Chong K, Buzzard IM. Computerized collection and analysis of dietary intake information. Comput Methods Programs Biomed. 1989 Sep;30(1):47-57. [CrossRef] [PubMed]
  17. Martin CK, Han H, Coulon SM, Allen HR, Champagne CM, Anton SD. A novel method to remotely measure food intake of free-living individuals in real time: the remote food photography method. Br J Nutr. 2009 Feb;101(3):446-56. [CrossRef] [PubMed]
  18. U.S. Department of Agriculture How the HEI Is Scored. 03/16/2018. Available at https://www.fns.usda.gov/how-hei-scored (accessed 11-11-21).
  19. Buysse DJ, Ancoli-Israel S, Edinger JD, Lichstein KL, Morin CM. Recommendations for a standard research assessment of insomnia. Sleep. 2006 Sep;29(9):1155-73. [CrossRef] [PubMed]Erratum in: Sleep. 2006 Nov 1;29(11):1380.
  20. U.S. Department of Agriculture and U.S. Department of Health and Human Services. Dietary Guidelines for Americans, 2020-2025. 9th Edition. December 2020. Available at https://dietaryguidelines.gov/ (accessed 11-11-21).
  21. Department of Health and Human Services and U.S. Department of Agriculture. 2015–2020 Dietary Guidelines for Americans. 2015–2020 Dietary Guidelines for Americans. 8th Edition. December 2015. Available at https://health.gov/our-work/food-nutrition/previous-dietary-guidelines/2015 (accessed 11-11-21).
  22. Dashti HS, Scheer FA, Jacques PF, Lamon-Fava S, Ordovás JM. Short sleep duration and dietary intake: epidemiologic evidence, mechanisms, and health implications. Adv Nutr. 2015 Nov 13;6(6):648-59. [CrossRef] [PubMed]
  23. Kye S, Kwon SO, Lee SY, Lee J, Kim BH, Suh HJ, Moon HK. Under-reporting of Energy Intake from 24-hour Dietary Recalls in the Korean National Health and Nutrition Examination Survey. Osong Public Health Res Perspect. 2014 Apr;5(2):85-91. [CrossRef] [PubMed]
  24. Bothwell EK, Ayala GX, Conway TL, Rock CL, Gallo LC, Elder JP. Underreporting of food intake among Mexican/Mexican-American Women: rates and correlates. J Am Diet Assoc. 2009 Apr;109(4):624-32. [CrossRef] [PubMed]
  25. St-Onge MP, Mikic A, Pietrolungo CE. Effects of Diet on Sleep Quality. Adv Nutr. 2016 Sep 15;7(5):938-49. [CrossRef] [PubMed]
  26. Ding C, Lim LL, Xu L, Kong APS. Sleep and Obesity. J Obes Metab Syndr. 2018 Mar 30;27(1):4-24. [CrossRef] [PubMed]
  27. Landry GJ, Best JR, Liu-Ambrose T. Measuring sleep quality in older adults: a comparison using subjective and objective methods. Front Aging Neurosci. 2015 Sep 7;7:166. [CrossRef] [PubMed]
  28. Van Dongen HP, Maislin G, Mullington JM, Dinges DF. The cumulative cost of additional wakefulness: dose-response effects on neurobehavioral functions and sleep physiology from chronic sleep restriction and total sleep deprivation. Sleep. 2003 Mar 15;26(2):117-26. [CrossRef] [PubMed] Erratum in: Sleep. 2004 Jun 15;27(4):600.
  29. Zavecz Z, Nagy T, Galkó A, Nemeth D, Janacsek K. The relationship between subjective sleep quality and cognitive performance in healthy young adults: Evidence from three empirical studies. Sci Rep. 2020 Mar 17;10(1):4855. [CrossRef] [PubMed]
  30. Rehm CD, Monsivais P, Drewnowski A. Relation between diet cost and Healthy Eating Index 2010 scores among adults in the United States 2007-2010. Prev Med. 2015 Apr;73:70-5. [CrossRef] [PubMed]
Cite as: Batool-Anwar S, Mayer C, Haynes PL, Liu Y, Thomson CA, Quan SF. Impact of Recent Job Loss on Sleep, Energy Consumption and Diet. Southwest J Pulm Crit Care. 2021;23(5):129-37. doi: https://doi.org/10.13175/swjpcc045-21 PDF
Monday
Jul122021

Long-term All-Cause Mortality Risk in Obstructive Sleep Apnea Using Hypopneas Defined by a ≥3 Percent Oxygen Desaturation or Arousal

Rohit Budhiraja, MD1

Stuart F. Quan, MD1,2

1Division of Sleep and Circadian Disorders, Brigham and Women’s Hospital, Boston, MA

2Arizona Asthma and Airways Research Center, University of Arizona College of Medicine, Tucson, AZ    


Abstract

Study Objectives: Some prior studies have demonstrated an increase in mortality associated with obstructive sleep apnea (OSA) utilizing a definition of OSA that requires a minimum 4% oxygen desaturation to identify a hypopnea. No large community-based studies have determined the risk of long-term mortality with OSA with hypopneas defined by a ≥3% O2 desaturation or arousal (AHI3%A).

Methods: Data from 5591 Sleep Heart Health Study participants without prevalent cardiovascular disease at baseline who underwent polysomnography were analyzed regarding OSA diagnosed using the AHI3%A criteria and all-cause mortality over a mean follow up period of 10.9±3.2 years.

Results: There were 1050 deaths in this group during the follow-up period. A Kaplan-Meir plot of survival revealed a reduction in survival with increasing AHI severity. Cox proportional hazards regression models revealed significantly increased all-cause mortality risk with increasing AHI, hazard ratio (HR, 95% CI) 1.13 (1.04-1.23), after adjusting for age, sex, race, BMI, cholesterol, HDL, self-reported hypertension and/or diabetes and smoking status. In categorical models, the mortality risk was significantly higher with severe OSA [adjusted HR 1.38 (1.09-1.76)]. When stratified by gender or age, severe OSA was associated with increased risk of death in men [adjusted HR 1.14 (1.01-1.28)] and in those <70 years of age [adjusted HR 1.51 (1.02-2.26)]. In contrast, AHI severity was not associated with increased mortality in women or those ≥70 years of age in fully adjusted models.

Conclusion: Severe AHI3%A OSA is associated with significantly increased mortality risk, especially in men and those <70 years of age.

Introduction

Obstructive sleep apnea (OSA) is a prevalent disorder associated with diverse physiological changes. Intermittent hypoxia-reoxygenation, sympathetic nervous system activation and endothelial dysfunction have been demonstrated in OSA and likely contribute to adverse outcomes including daytime sleepiness, hypertension, coronary artery disease, and stroke (1,2). It is also associated with increased mortality, especially in those with more severe disease (3-7).

The severity of OSA is most frequently categorized using the apnea hypopnea index (AHI). However, the definition of the ‘hypopnea’ component of this index remains a matter of controversy. American Academy of Sleep Medicine (AASM) guidelines recommend that hypopnea be defined as a 30% or greater reduction in the airflow associated with either ≥3% decrease in oxyhemoglobin saturation, or an arousal from sleep (AHI3%A) (8). However, Centers for Medicare and Medicaid Services (CMS), along with several other payors in the United States, utilize an alternate hypopnea definition that requires at least a 4% desaturation and does not recognize arousals for defining hypopnea (AHI4%). The reimbursement for OSA therapy from these payors is reserved for the subset of patients that meets this more stringent definition of OSA. Unfortunately, this policy systematically deprives some patients, even those with clear symptoms attributable to sleep apnea such as increased sleepiness, of appropriate therapy, since they do not meet the higher diagnostic cutoff mandated by this definition.

Much of the current status quo may be related to a lack of substantial data evaluating the impact of hypopnea events associated with less severe desaturation or arousals on diverse OSA outcomes. In contrast, several large cohort studies have established a robust relationship between OSA defined using the AHI4% definition and cardiovascular outcomes (9-11). Two large community-based longitudinal studies demonstrating an association between OSA severity and all-cause mortality, that from Sleep Heart Health Study (SHHS) cohort (3) and that from Wisconsin Sleep Cohort (5), also utilized the AHI4% definition. However, no large community-based longitudinal studies have assessed the association between OSA diagnosed using the AHI3%A definition and mortality. The current study utilized data from SHHS to assess the relationship between OSA defined by the AHI3%A at baseline and all-cause mortality over an 11-year follow up period.

Methods

Participants

The Sleep Heart Health Study (SHHS) was a multicenter cohort study that investigated prospectively the relationship between OSA and cardiovascular diseases in the United States. Details of the rationale and study design have been described elsewhere (12). Recruitment began in 1995 with eventual enrollment of 6,441 participants, 40 years of age and older, from several ongoing “parent” cardiovascular and respiratory disease cohorts who were initially assembled between 1976 and 1995 (13). These “parent” cohorts consisted of the Offspring and the Omni Cohorts of the Framingham Heart Study in Massachusetts; the Hagerstown, MD, and Minneapolis, MN, sites of the Atherosclerosis Risk in Communities Study; the Hagerstown, MD, Pittsburgh, PA, and Sacramento, CA, sites of the Cardiovascular Health Study; 3 hypertension cohorts (Clinic, Worksite, and Menopause) in New York City; the Tucson Epidemiologic Study of Airways Obstructive Diseases and the Health and Environment Study; and the Strong Heart Study of American Indians in Oklahoma, Arizona, North Dakota, and South Dakota. Between 1995 and 1997, these participants underwent a home sleep evaluation that included full unattended polysomnography to determine whether they had OSA. Subsequently, they were followed for mortal events by their parent cohorts. Follow-up duration was 10.9±3.2 years (Mean±SD). As shown in Figure 1, consent was withdrawn by 134 participants from the Arizona cohort of the Strong Heart Study because of sovereignty issues after the end of the follow-up period.

Figure 1. Diagram of Sleep Heart Health Study (SHHS) analytic cohort.

Participants with self-reported prevalent cardiovascular disease (CVD: coronary heart disease, stroke or congestive heart failure) at enrollment also were excluded. Consequently, there were 5,591 participants in the analytic cohort. Parent cohort data were used for documentation of age, height, sex and ethnicity. Co-morbid self-reported diabetes, cardiovascular disease (CVD), concurrent treatment for OSA and smoking status were ascertained from parent cohort data or from responses on health interview and sleep habit questionnaires administered on the evening of the polysomnography home visit (vide infra). Hypertension status was derived as previously described from blood pressure measurements on the night of the home visit and hypertensive medication use (14). Body mass index (BMI) was calculated as weight (kg)/height (m2).

Institutional review boards for human subjects’ research of the respective parent cohorts approved the study. Informed written consent was obtained from all participants at the time of their recruitment.

Polysomnography and Home Visit

Participants underwent overnight in-home polysomnograms using the Compumedics Portable PS-2 System (Abbottsville, Victoria, Australia) administered by trained technicians (15). The home visits were performed by two-person, mixed-sex teams in visits that lasted 1.5 to 2 hours. At the time of the home visit, blood pressure was measured manually in triplicate in a seated position after 5 minutes of rest (16). The average of the second and third measurements was used. Body weight was measured using a digital scale.

The SHHS recording montage for both the initial and follow-up sleep evaluations consisted of electroencephalogram (C4/A1 and C3/A2), right and left electrooculogram, a bipolar submental electromyogram, thoracic and abdominal excursions (inductive plethysmography bands), airflow (detected by a nasal-oral thermocouple [Protec, Woodinville, WA]), oximetry (finger pulse oximetry [Nonin, Minneapolis, MN]), electrocardiogram and heart rate (using a bipolar electrocardiogram lead), body position (using a mercury gauge sensor), and ambient light (on/off, by a light sensor secured to the recording garment). Equipment and sensors were applied and calibrated during the evening home visit by a study certified technician. In the morning, the equipment and the data stored in real time on PCMCIA cards, were retrieved and downloaded to the computers of each respective clinical site. The data were locally reviewed, and then forwarded to a central reading center (Case Western Reserve University, Cleveland, OH). Comprehensive descriptions of polysomnography scoring and quality-assurance procedures have been previously published (15,17). In brief, sleep was scored according to guidelines developed by Rechtschaffen and Kales (18). Strict protocols were maintained to ensure comparability among centers and technicians. Intra-scorer and inter-scorer reliabilities were high (17).

The apnea hypopnea index (AHI) was calculated for each participant using the AASM recommended definition of hypopnea. Thus, hypopneas were identified if the amplitude of a measure of flow or volume (detected by the thermocouple or thorax or abdominal inductance band signals) was reduced discernibly (at least 25% lower than baseline breathing) for at least 10 seconds, did not meet the criteria for apnea and the event was associated with either a ≥3% oxygen desaturation from baseline or terminated with electroencephalographic evidence of an arousal. An apnea was defined as a complete or almost complete cessation of airflow, as measured by the amplitude of the thermocouple signal, lasting at least 10 seconds.

Statistical Analyses

Mean and standard deviation were used to provide an overall description of the data used in the analyses. For analyses using the AHI, each participant’s AHI was assigned to one of 4 OSA severity categories: No OSA (AHI <5 /hour), Mild (AHI ≥5 and <15 /hour), Moderate (AHI ≥15 and < 30/hour) and Severe (AHI ≥30). For some analyses, because values for AHI were extremely left skewed, a natural log transformation was performed to express AHI as a continuous factor in the form of lnAHI+0.1. To nullify the impact of 0 values of the AHI, 0.1 was added to the ln function. Mortality rates were computed by dividing the number of deaths by accumulated person-years at risk.

Analysis of variance was used to test for differences within continuous variables and 2 was employed for categorial variables. A Kaplan-Meir plot was computed to assess the overall relationship between severity of OSA and mortality. Cox proportional hazards regression models were calculated to examine the association between AHI as a categorical and continuous factor and mortality. Covariates included in the models were sex, race, age, BMI, cholesterol, high density lipoprotein (HDL), hypertension and/or diabetes and smoking status. Consistent with a previous study assessing mortality in SHHS, age was dichotomized into those <70 and those ≥ 70 years (3). Race was stratified as non-Hispanic White or other. Smoking was recategorized into those who were current or former smokers and those who were never smokers. Prevalent hypertension or self-reported diabetes was expressed as present or absent. Three models were constructed: Model 1 adjusted for age, race and sex, Model 2 adjusted for covariates in Model 1 plus BMI and Model 3 adjusted for covariates in Models 1 and 2 plus cholesterol, HDL, hypertension/diabetes and smoking status.

Analyses were performed using IBM SPSS Statistics v27 (Armonk, NY). The survival package in R was used to obtain the Kaplan Meir plot. A p value of <0.05 was considered statistically significant.

Results

Demographic and clinical characteristics of the cohort stratified by AHI are shown in Table 1.

Table 1. Baseline Characteristics Stratified by Apnea Hypopnea Indexa,b

Age and BMI increased across AHI strata as well as the % of men, current/ex-smokers, diabetic/hypertensives and non-Hispanic Whites. In contrast, HDL decreased. No changes were observed for cholesterol or % receiving OSA treatment.

Figure 2 depicts the Kaplan-Meir plot of survival over ~11 years of follow-up stratified by AHI categories.

Figure 2. Kaplan Meir plot of survival stratified by apnea hypopnea (AHI) severity.

There was a clear reduction in survival with apparent differences related to AHI severity. However, because several covariates also impacted survival across AHI strata, multivariate proportional hazard modelling was employed as shown in for all participants as shown in Table 2.

Table 2. Hazard Ratios (95% confidence intervals) for All-Cause Mortality

There were 1,050 deaths with full covariate data available for analysis. For the categorical modelling, there was an increase in the hazard ratio as the AHI severity increased, but this was only statistically significant at an AHI ≥30 /h (HR: 1.36, 95% CI: 1.09-1.69). Increasing model complexity did not alter this finding. A model using AHI as a continuous factor also demonstrated a significant association between severity of AHI and increasing mortality in a fully adjusted model. A sensitivity analysis where concurrent OSA treatment was included also did not change this relationship.

Because previous analyses have demonstrated differences in mortality between men and women, sex stratified analyses were performed as shown in Table 3.

Table 3. Hazard Ratios (95% confidence intervals) for All-Cause Mortality Stratified by Sex

These findings confirmed that in men AHI severity in both categorical and continuous analyses was associated with increased mortality. As observed in the combined analyses, this was only statistically significant in the continuous analysis (HR: 1.14, 95% CI: 1.01-1.28) although strong trends were noted in the categorical analyses in all models. In women, however, the relationship between AHI severity and mortality was less robust. In demographic (Model 1) and demographic/anthropometric (Model 2) adjusted analyses, an AHI ≥30 /h was associated with increased mortality, but this observation was attenuated and lost statistical significance in the fully adjusted categorical and continuous models.

Table 4 shows age stratified analyses comparing those <70 years to those ≥70 years of age.

Table 4. Hazard Ratios (95% confidence intervals) for All-Cause Mortality Stratified by Age at 70 years

In those who were <70 years, AHI severity was strongly associated with increased mortality. Although this finding was statistically significant only at AHI ≥30 /h in the fully adjusted model, it was significant at AHI 15-29.9/h in less complex models (HR: 1.45, 95% CI: 1.03-2.04) and approached significance in the fully adjusted model (HR: 1.41, 95% CI: 0.98-2.00). In contrast, AHI severity was not found to be associated with increased mortality among those ≥70 years of age in either categorial or continuous models.

Of the 1,050 deaths used in the proportional hazard models, 258 (24.7%) were classified as related to CVD. In analyses restricted to CVD deaths, a Kaplan-Meir plot (not shown) indicated a reduction in survival with increasing OSA severity (Log Rank 2 = 11.2-20.4 for comparisons vs. AHI <5 /h, p<.001). However, in fully adjusted proportional hazard models, no differences in survival attributable to OSA were observed.

Discussion

The current study demonstrated using the AHI3%A definition of hypopnea, a significant association between increasing severity of AHI and all-cause mortality in a model adjusted for relevant anthropometric and demographic factors and clinical co-morbidities. In stratified analyses, this association was more robust among men than in women, and those below 70 years of age compared to the older subjects.

Notably, some earlier studies have demonstrated an increase in mortality associated with OSA. An 18-year follow-up from Wisconsin cohort revealed a significantly increased hazard ratio for all-cause mortality and cardiovascular mortality in severe OSA (5). Punjabi et al. (3) used data from SHHS and demonstrated an increase in all-cause mortality with severe OSA, particularly in men aged 40–70, during an average follow-up period of 8.2 years. Both these studies utilized the AHI4% criteria for OSA diagnosis. Similarly, Martínez-García (19) utilized AHI4% criteria in a clinic population of 939 elderly (median follow-up, 69 months) and found HR of 2.25 for cardiovascular mortality in the untreated severe OSA group. A study from Denmark included 22,135 OSA patients found that male gender, age>40 years, diabetes (types 1 and 2), hypertension, and heart failure were associated with greater mortality (criteria for hypopnea not specified (6). Marin et al. (10) also noted increased fatal and non-fatal cardiovascular events in men with untreated severe OSA diagnosed using the AHI4% criteria during a mean 10.1 years follow-up period. A meta-analysis with 11,932 patients from 6 prospective observational studies found severe OSA to be a strong independent predictor for cardiovascular and all-cause mortality (4). Finally, a meta-analysis of 27 cohort studies included 3,162,083 participants showed higher all-cause mortality in severe OSA and lower mortality in CPAP-treated than in untreated patients (7). Virtually all of these aforementioned studies utilized a definition of OSA requiring a minimum 4% oxygen desaturation to identify a hypopnea.

To our knowledge, our study is the first large community-based study to assess the association between OSA diagnosed using the AHI3%A criteria and mortality. Severe OSA was associated with a higher mortality, especially in those <70 years of age, and in men. Consistent with our findings, an earlier study in a clinical population of over 10,000 adults observed OSA diagnosed utilizing AHI3%A criteria predicted incident sudden cardiac death (20). The higher mortality risk in men and in younger people is similar to that reported in other analyses from this database using AHI4% criteria (3,21). Our results provide evidence that the more liberal AHI3%A criteria is associated with increased all-cause mortality thus providing further justification for its use in identifying persons with OSA who may benefit from treatment.

We observed that approximately 25% of the deaths in our analytic cohort were attributable to CVD. Data from the Wisconsin Sleep Cohort indicate that excess mortality associated with OSA over a 18 year follow-up is partially related to CVD (5). Our unadjusted analyses are consistent with this observation. However, our study did not have sufficient power in adjusted models to replicate it.

There are several factors that could explain the association between OSA and increased mortality. OSA increases the risk for hypertension, cardiovascular disease, diabetes, and stroke and can, thus, increase mortality. Hypoxemic burden has been suggested to be a conspicuous factor conferring an increased mortality risk (22). Other factors, however, may also play a notable role. Analyses from 5,712 participants revealed that short respiratory event duration, a marker for low arousal threshold, was associated with higher mortality risk (21). The authors hypothesized that the shorter event duration reflected greater “arousability”, resulting in greater sleep fragmentation, shorter sleep, and excess sympathetic tone, and hence increased mortality. Arousals are associated with an increase in the sympathetic activity and a decrease in the parasympathetic activity and data support their role in the development of hypertension.

From a clinical perspective, utilizing the AHI4% criteria in lieu of AHI3%A to identify persons as having OSA impacts those who are classified as having OSA by the latter standard, but not the former. Using the SHHS database, we found that 36.1% of individuals fall into this category. Importantly, similar to persons who were classified as having OSA by both criteria, we observed that this group who were designated as having OSA by only AHI3%A criteria had increased rates of prevalent and incident hypertension (23,24). There also was a significant association with CVD (25). Combined with these previous studies, the current analyses demonstrating increased mortality associated with OSA defined by AHI3%A criteria provide evidence that use of this more liberal definition will benefit patients.

This study has several strengths. SHHS is large, ethnically diverse cohort, making the results more generalizable. The cohorts were community-based, obviating any referral bias. Polysomnography, the gold standard diagnostic test for OSA, was performed on all individuals. The substantive database allowed controlling for multiple confounders. Finally, the participants were followed for an ample time with the average follow-up period of 11 years.

The study also has some limitations. First, being a community derived cohort, the severity of OSA seen in SHHS was generally mild to moderate. The outcomes, including mortality, would be expected to be worse in a clinical cohort with higher severity of sleep apnea. Secondly, while the current study included a substantial number of potential covariates in the models, residual confounding from other factors may have occurred. Thirdly, the severity of OSA may have changed over the follow up period. Fourthly, while the follow-up period of the study was long, it is possible that an even longer follow-up period may have allowed a better estimate of the long-term impact of OSA on mortality. Finally, although the study demonstrated increased mortality risk, elucidation of the mechanisms thereof was beyond the scope of this study.

In conclusion, the current study demonstrated in a large community-based cohort that even OSA defined by a more liberal AHI3%A is associated with increased mortality. Considering the adverse outcomes associated with OSA, a restrictive definition that excludes these persons from warranted OSA therapy is potentially deleterious to overall health with significant individual and healthcare implications.

References

  1. Javaheri S, Barbe F, Campos-Rodriguez F, et al. Sleep Apnea: Types, Mechanisms, and Clinical Cardiovascular Consequences. J Am Coll Cardiol. 2017 Feb 21;69(7):841-858. [CrossRef] [PubMed]
  2. Budhiraja R, Parthasarathy S, Quan SF. Endothelial dysfunction in obstructive sleep apnea. J Clin Sleep Med. 2007 Jun 15;3(4):409-15. [PubMed]
  3. Punjabi NM, Caffo BS, Goodwin JL, Gottlieb DJ, Newman AB, O'Connor GT, Rapoport DM, Redline S, Resnick HE, Robbins JA, Shahar E, Unruh ML, Samet JM. Sleep-disordered breathing and mortality: a prospective cohort study. PLoS Med. 2009 Aug;6(8):e1000132. [CrossRef] [PubMed]
  4. Ge X, Han F, Huang Y, Zhang Y, Yang T, Bai C, Guo X. Is obstructive sleep apnea associated with cardiovascular and all-cause mortality? PLoS One. 2013 Jul 25;8(7):e69432. [CrossRef] [PubMed]
  5. Young T, Finn L, Peppard PE, Szklo-Coxe M, Austin D, Nieto FJ, Stubbs R, Hla KM. Sleep disordered breathing and mortality: eighteen-year follow-up of the Wisconsin sleep cohort. Sleep. 2008 Aug;31(8):1071-8. [PubMed]
  6. Jennum P, Tønnesen P, Ibsen R, Kjellberg J. Obstructive sleep apnea: effect of comorbidities and positive airway pressure on all-cause mortality. Sleep Med. 2017 Aug;36:62-66. [CrossRef] [PubMed]
  7. Fu Y, Xia Y, Yi H, Xu H, Guan J, Yin S. Meta-analysis of all-cause and cardiovascular mortality in obstructive sleep apnea with or without continuous positive airway pressure treatment. Sleep Breath. 2017 Mar;21(1):181-189. [CrossRef] [PubMed]
  8. Berry RB, Budhiraja R, Gottlieb DJ, et al. Rules for scoring respiratory events in sleep: update of the 2007 AASM Manual for the Scoring of Sleep and Associated Events. Deliberations of the Sleep Apnea Definitions Task Force of the American Academy of Sleep Medicine. J Clin Sleep Med. 2012 Oct 15;8(5):597-619. [CrossRef] [PubMed]
  9. Gottlieb DJ, Yenokyan G, Newman AB, O'Connor GT, Punjabi NM, Quan SF, Redline S, Resnick HE, Tong EK, Diener-West M, Shahar E. Prospective study of obstructive sleep apnea and incident coronary heart disease and heart failure: the sleep heart health study. Circulation. 2010 Jul 27;122(4):352-60. [CrossRef] [PubMed]
  10. Marin JM, Carrizo SJ, Vicente E, Agusti AG. Long-term cardiovascular outcomes in men with obstructive sleep apnoea-hypopnoea with or without treatment with continuous positive airway pressure: an observational study. Lancet. 2005 Mar 19-25;365(9464):1046-53. [CrossRef] [PubMed]
  11. Peppard PE, Young T, Palta M, Skatrud J. Prospective study of the association between sleep-disordered breathing and hypertension. N Engl J Med. 2000 May 11;342(19):1378-84. [CrossRef] [PubMed]
  12. Quan SF, Howard BV, Iber C, et al. The Sleep Heart Health Study: design, rationale, and methods. Sleep. 1997 Dec;20(12):1077-85. [PubMed]
  13. Lind BK, Goodwin JL, Hill JG, Ali T, Redline S, Quan SF. Recruitment of healthy adults into a study of overnight sleep monitoring in the home: experience of the Sleep Heart Health Study. Sleep Breath. 2003 Mar;7(1):13-24. [CrossRef] [PubMed]
  14. Nieto FJ, Young TB, Lind BK, Shahar E, Samet JM, Redline S, D'Agostino RB, Newman AB, Lebowitz MD, Pickering TG. Association of sleep-disordered breathing, sleep apnea, and hypertension in a large community-based study. Sleep Heart Health Study. JAMA. 2000 Apr 12;283(14):1829-36. [CrossRef] [PubMed]
  15. Redline S, Sanders MH, Lind BK, Quan SF, Iber C, Gottlieb DJ, Bonekat WH, Rapoport DM, Smith PL, Kiley JP. Methods for obtaining and analyzing unattended polysomnography data for a multicenter study. Sleep Heart Health Research Group. Sleep. 1998 Nov 1;21(7):759-67. [PubMed]
  16. O'Connor GT, Caffo B, Newman AB, Quan SF, Rapoport DM, Redline S, Resnick HE, Samet J, Shahar E. Prospective study of sleep-disordered breathing and hypertension: the Sleep Heart Health Study. Am J Respir Crit Care Med. 2009 Jun 15;179(12):1159-64. [CrossRef] [PubMed]
  17. Whitney CW, Gottlieb DJ, Redline S, Norman RG, Dodge RR, Shahar E, Surovec S, Nieto FJ. Reliability of scoring respiratory disturbance indices and sleep staging. Sleep. 1998 Nov 1;21(7):749-57. [CrossRef] [PubMed]
  18. Rechtschaffen A. A manual for standardized terminology, techniques and scoring system for sleep stages in human subjects. Brain information service. Washington, DC : United States Government Printing Office, 1968.
  19. Martínez-García MA, Campos-Rodríguez F, Catalán-Serra P, Soler-Cataluña JJ, Almeida-Gonzalez C, De la Cruz Morón I, Durán-Cantolla J, Montserrat JM. Cardiovascular mortality in obstructive sleep apnea in the elderly: role of long-term continuous positive airway pressure treatment: a prospective observational study. Am J Respir Crit Care Med. 2012 Nov 1;186(9):909-16. [CrossRef] [PubMed]
  20. Gami AS, Olson EJ, Shen WK, Wright RS, Ballman KV, Hodge DO, Herges RM, Howard DE, Somers VK. Obstructive sleep apnea and the risk of sudden cardiac death: a longitudinal study of 10,701 adults. J Am Coll Cardiol. 2013 Aug 13;62(7):610-6. [CrossRef] [PubMed]
  21. Butler MP, Emch JT, Rueschman M, Sands SA, Shea SA, Wellman A, Redline S. Apnea-Hypopnea Event Duration Predicts Mortality in Men and Women in the Sleep Heart Health Study. Am J Respir Crit Care Med. 2019 Apr 1;199(7):903-912. [CrossRef] [PubMed]
  22. Azarbarzin A, Sands SA, Stone KL, et al. The hypoxic burden of sleep apnoea predicts cardiovascular disease-related mortality: the Osteoporotic Fractures in Men Study and the Sleep Heart Health Study. Eur Heart J. 2019 Apr 7;40(14):1149-1157. [CrossRef] [PubMed]
  23. Budhiraja R, Javaheri S, Parthasarathy S, Berry RB, Quan SF. The Association Between Obstructive Sleep Apnea Characterized by a Minimum 3 Percent Oxygen Desaturation or Arousal Hypopnea Definition and Hypertension. J Clin Sleep Med. 2019 Sep 15;15(9):1261-1270. [CrossRef] [PubMed]
  24. Budhiraja R, Javaheri S, Parthasarathy S, Berry RB, Quan SF. Incidence of hypertension in obstructive sleep apnea using hypopneas defined by 3 percent oxygen desaturation or arousal but not by only 4 percent oxygen desaturation. J Clin Sleep Med. 2020 Oct 15;16(10):1753-1760. [CrossRef] [PubMed]
  25. Quan SF, Budhiraja R, Javaheri S, Parthasarathy S, Berry RB. The association between obstructive sleep apnea defined by 3 percent oxygen desaturation or arousal definition and self-reported cardiovascular disease in the Sleep Heart Health Study. Southwest J Pulm Crit Care. 2020;21(4):86-103. [CrossRef]

Abbreviations

  • AASM            American Academy of Sleep Medicine
  • AHI               Apnea hypopnea index
  • AHI3%A        Apnea hypopnea index defined using a hypopnea definition requiring a minimum 3% O2 desaturation or arousal
  • AHI4%          Apnea hypopnea index defined using a hypopnea definition requiring a minimum 4% O2 desaturation
  • BMI              Body mass index
  • CMS             Centers for Medicare and Medicaid Services
  • CVD             Cardiovascular disease
  • HDL              High density lipoprotein
  • HR               Hazard ratio
  • OSA             Obstructive sleep apnea
  • SHHS           Sleep Heart Health Study

Acknowledgements

The Sleep Heart Health Study was supported by National Heart, Lung and Blood Institute cooperative agreements U01HL53940 (University of Washington), U01HL53941 (Boston University), U01HL53938 (University of Arizona), U01HL53916 (University of California, Davis), U01HL53934 (University of Minnesota), U01HL53931 (New York University), U01HL53937 and U01HL64360 (Johns Hopkins University), U01HL63463 (Case Western Reserve University), and U01HL63429 (Missouri Breaks Research). A list of SHHS investigators, staff and their participating institutions is available on the SHHS website, http://jhuccs1.us/shhs/details/investigators.htm.

Cite as: Budhiraja R, Quan SF. Long-term all-cause mortality risk in obstructive sleep apnea using hypopneas defined by a ≥3 percent oxygen desaturation or arousal. Southwest J Pulm Crit Care. 2021;23(1):23-35. doi: https://doi.org/10.13175/swjpcc025-21 PDF

Monday
Oct192020

The Association Between Obstructive Sleep Apnea Defined by 3 Percent Oxygen Desaturation or Arousal Definition and Self-Reported Cardiovascular Disease in the Sleep Heart Health Study

Stuart F. Quan, M.D.1,2

Rohit Budhiraja, M.D.1

Sogol Javaheri, M.A., M.D., M.P.H.1

Sairam Parthasarathy, M.D.2

Richard B. Berry, M.D.3

1Division of Sleep and Circadian Disorders, Brigham and Women’s Hospital, Harvard Medical School, Boston, MA; 2Department of Medicine, University of Arizona College of Medicine, Tucson, AZ; 3Division of Pulmonary, Critical Care, and Sleep Medicine, University of Florida, Gainesville, FL

Editor's Note: Click here to see an accompanying editorial.

Abstract

Background: Studies have established that OSA defined using a hypopnea definition requiring a >4% oxygen desaturation (AHI4%) is associated with cardiovascular (CVD) or coronary heart (CHD) disease. This study determined whether OSA defined using a hypopnea definition characterized by a >3% oxygen desaturation or an arousal (AHI3%A) is associated with CVD/CHD.

Methods: Data were analyzed from 6307 Sleep Heart Health Study participants who had polysomnography. Self-reported CVD included angina, heart attack, heart failure, stroke or previous coronary bypass surgery or angioplasty. Self-reported CHD included the aforementioned conditions but not stroke or heart failure. The association between OSA and CVD/CHD was examined using logistic regression models with stepwise inclusion of demographic, anthropometric, social/behavioral and co-morbid medical conditions. A parsimonious model in which diabetes and hypertension were excluded because of their potential to be on the causal pathway between OSA and CVD/CHD also was constructed.

Results: For CVD, the odds ratios and 95% confidence intervals for AHI3%A >30/hour were 1.39 (1.03-1.87) and 1.45 (1.09-1.94) in the fully adjusted and parsimonious models. Results for CHD were 1.29 (0.96-1.74) and 1.36 (0.99-1.85). In participants without OSA according to more stringent AHI4% criteria but with OSA using the AHI3%A definition, similar findings were observed.

Conclusion: OSA defined using an AHI3%A is associated with both CVD and CHD. Use of a more restrictive AHI4% definition will misidentify a large number of individuals with OSA who have CVD or CHD. These individuals may be denied access to therapy, potentially worsening their underlying CVD or CHD. 

Introduction

Obstructive sleep apnea (OSA) is a common disorder characterized by recurrent episodes of either complete upper airway collapse (apneas) or partial collapse (hypopneas) during sleep. A number of large studies have established that OSA is a risk factor for the development of hypertension and cardiovascular disease (CVD) as well as higher mortality; individuals with more severe OSA are at greater risk (1-3). The most commonly used metric of OSA severity is the apnea hypopnea index (AHI). However, there is controversy regarding the definition of the AHI. In 2012, the American Academy of Sleep Medicine (AASM) recommended that the hypopnea definition include any decrease in airflow by at least 30% from the baseline with an oxyhemoglobin desaturation of at least 3%, or an arousal from sleep (4). However, several payors including the Centers for Medicare and Medicaid Services (CMS) continue to require a more stringent hypopnea definition necessitating a 4% or greater decrease in oxygen saturation (5) despite evidence documenting a relationship between the AASM recommended standard and daytime sleepiness (6). The resistance to universal acceptance of the AASM criteria is based in part on the lack of evidence that 3% desaturations or arousals have an adverse cardiovascular impact. This reluctance to adopt a more inclusive definition of sleep apnea has restricted access to OSA treatment for many patients (7). Therefore, determining if there is relationship between OSA characterized by at least 3% drop in saturation or an arousal from sleep and CVD may assist in identification of persons at risk for CVD, allow greater access to care and potentially improve other health-related outcomes.

Using the database from the Sleep Heart Health Study, a large well-characterized community based cohort that had undergone polysomnography, the current study aimed to determine the association between the AASM recommended definition of the AHI which incorporates hypopneas with at least a 3% desaturation or an arousal (AHI3%A) and self-reported CVD and coronary heart disease (CHD) in middle-aged and older adults. In addition, we sought to ascertain whether there was an association between CVD or CHD and OSA severity among individuals who were not identified as having OSA using the more restrictive standard of requiring at least a 4% oxygen desaturation irrespective of an arousal (AHI4%), but were classified as having OSA by the AHI3%A definition. We hypothesized that increasing OSA severity represented by the AHI3%A would be associated with a greater likelihood of having prevalent CVD or CHD, and that persons who were not identified as having OSA using the AHI4% criteria would have a higher likelihood as well.

Methods

This study analyzed data obtained from the Sleep Heart Health Study (SHHS) which was a prospective multicenter cohort study designed to investigate the relationship between OSA and cardiovascular diseases in the United States. The study’s rationale and design have been published elsewhere (8). Briefly, 6,441 subjects, 40 years of age and older were recruited starting in 1995 from several ongoing “parent” cardiovascular and respiratory disease cohorts that were initially assembled between 1976 and 1995 (9). These cohorts included the Offspring Cohort and the Omni Cohort of the Framingham Heart Study in Massachusetts; the Hagerstown, MD, and Minneapolis, MN, sites of the Atherosclerosis Risk in Communities Study; the Hagerstown, MD, Pittsburgh, PA, and Sacramento, CA, sites of the Cardiovascular Health Study; 3 hypertension cohorts (Clinic, Worksite, and Menopause) in New York City; the Tucson Epidemiologic Study of Airways Obstructive Diseases and the Health and Environment Study; and the Strong Heart Study of American Indians in Oklahoma, Arizona, North Dakota, and South Dakota. Because of sovereignty issues, 134 participants from the Arizona cohort of the Strong Heart Study withdrew consent. Analyses were performed on the remaining 6307 participants. The SHHS was approved by each site’s institutional review board for human subjects’ research, and informed written consent was obtained from all subjects at the time of their enrollment.

Polysomnography and Home Visit

Participants underwent overnight in-home polysomnograms using the Compumedics Portable PS-2 System (Abbottsville, Victoria, Australia) administered by trained technicians (10). The home visits were performed by two-person, mixed-sex teams in visits that lasted 1.5 to 2 hours. Participants were asked to schedule the visit so that it would occur approximately two hours prior to their usual bedtime. At the time of the home visit, an inventory of each participant’s medications was made. In addition, a health interview was completed that ascertained the presence of several health conditions. Questionnaires that were completed included the SHHS Sleep Habits Questionnaire which incorporated the Epworth Sleepiness Scale (ESS) (11) and the Medical Outcomes Study SF-36 (12). Blood pressure was measured manually in triplicate in a seated position after 5 minutes of rest (13). The average of the second and third measurements was used for this analysis. Body weight was obtained using a digital scale.

The SHHS recording montage consisted of electroencephalogram (C4/A1 and C3/A2), right and left electrooculogram, a bipolar submental electromyogram, thoracic and abdominal excursions (inductive plethysmography bands), airflow (detected by a nasal-oral thermocouple (Protec, Woodinville, WA), oximetry (finger pulse oximetry [Nonin, Minneapolis, MN]), electrocardiogram and heart rate (using a bipolar electrocardiogram lead), body position (using a mercury gauge sensor), and ambient light (on/off, by a light sensor secured to the recording garment). Sensors were placed, and equipment was calibrated during an evening home visit by a certified technician. After technicians retrieved the equipment, the data, stored in real time on PCMCIA cards, were downloaded to the computers of each respective clinical site, locally reviewed, and forwarded to a central reading center (Case Western Reserve University, Cleveland, OH). Comprehensive descriptions of polysomnography scoring and quality-assurance procedures have been previously published (14). In brief, sleep was scored according to guidelines developed by Rechtschaffen and Kales (15). Strict protocols were maintained to ensure comparability among centers and technicians. Intra-scorer and inter-scorer reliabilities were high (14).

The apnea hypopnea index (AHI) was calculated for each participant using two definitions of hypopnea, the AASM recommended definition [AHI3%A] and the AASM acceptable [CMS] definition [AHI4%]. For AHI3%A, hypopneas were identified if the amplitude of a measure of flow or volume (detected by the thermocouple or thorax or abdominal inductance band signals) was reduced discernibly (at least 30% lower than baseline breathing) for at least 10 seconds, did not meet the criteria for apnea and the event was associated with either a 3% oxygen desaturation from baseline or terminated with electroencephalographic evidence of an arousal. For AHI4%, hypopneas were identified if the aforementioned reduction in flow or volume occurred and the event was associated with a 4% oxygen desaturation from baseline. In both cases, an apnea was defined as a complete or almost complete cessation of airflow, as measured by the amplitude of the thermocouple signal, lasting at least 10 seconds.

Outcome Assessment

Self-reported CVD and CHD were the outcomes of interest for this analysis and were obtained from the standardized health interview performed at the time of each participant’s polysomnography home visit. Participants were asked if they had ever been told by a doctor that she or he had angina, heart attack, heart failure, or stroke and if the participant had ever undergone coronary bypass surgery or coronary angioplasty. Prevalent CVD was defined as a positive response to one or more of the aforementioned conditions or procedures. Prevalent CHD was defined as an affirmative response to the same questions with the exclusion of responses to the presence of heart failure or stroke.

Covariates

Selection of potential covariates was based on previous studies documenting an association with either CVD or CHD. These included various demographic (e.g., sex, race/ethnicity, education, marital status), anthropometric (e.g., height, weight and blood pressure [BP]), social/behavioral (e.g., smoking history, alcohol use, sleep duration, quality of life) indices as well as plasma lipids (cholesterol, high density lipoprotein [HDL], triglycerides), several diseases (depression, hypertension, diabetes) and spirometry.

The following definitions were used for those covariates that were not primarily recorded. Body mass index (BMI) was calculated as weight (kg)/height (m2). The ankle arm index (AAI) was computed as the ratio of blood pressure at the ankle to that in the arm. Waist to hip ratio was the waist divided by hip circumferences. Hypertension was defined as a self-report of hypertension or the use of anti-hypertensive medications. Diabetes was considered present if it was self-reported by the participant or if there was use of oral hypoglycemic agents or insulin. Depression was defined as present if the participant indicated on the SF-36 that he/she was feeling “blue” or “down” for at least “a good bit of the time” for the previous 4 weeks, or he/she was using antidepressant medications. Insomnia was defined as often or almost always having “trouble falling asleep”, “waking up during the middle of the night and having difficulty getting back to sleep” or “waking up too early in the morning and being unable to get back to sleep”. Sleepiness was assessed by the ESS as well as by self-report of being excessively sleepy during the day most or almost all of the time.

Statistical Analyses

Mean and standard deviation, and percentages were used to provide an overall description of the data used in the analyses. Unadjusted differences were compared using Student’s t test or c2. For both definitions of the AHI, each participant’s AHI was assigned to one of 4 OSA severity categories: Normal (AHI <5 /hour), Mild (AHI ≥5 and <15 /hour), Moderate (AHI ≥15 and < 30/hour) and Severe (AHI ≥30/hour).

Missing data was present in 4.8% of observations and were felt to be missing at random. Inasmuch as using a “complete case analysis” would result in exclusion of a significant number of participants from our analyses with a consequent reduction in statistical power, multiple imputation using the multiple imputation by chained equation (MICE) package in R was employed to generate replacement values. Comparison of the imputed to the original dataset did not identify any outliers in the imputed dataset and means of the same variables between datasets were comparable.

To reduce the number of relevant predictors, overfitting of models, reduce potential collinearity and minimize prediction error, a Least Absolute Shrinkage and Selection Operator (lasso) regression was performed for both outcome variables using the glmnet package in R. This resulted in an analytic dataset for CVD that consisted of the following: age, sex, race/ethnicity, BMI, AAI, diastolic BP, smoking, SF-36 physical component summary (PCS), SF-36 general health rating (GenHlth), SF-36 ability to perform vigorous activity (VigActiv), hypertension, diabetes, depression and HDL. For CHD, the analytic dataset consisted of the following: age, sex, race/ethnicity, BMI, diastolic BP, smoking, PCS, GenHlth, VigActiv, hypertension, diabetes, triglycerides and HDL.

For the entire cohort, logistic regression using SPSS v27 (Armonk, NY) was used to generate increasingly complex models of the relationship between either CVD or CHD and severity of OSA adjusting for the covariates identified using the lasso regression. For CVD, after the unadjusted model, models were generated for the sequential addition of demographic factors (age, sex, race/ethnicity), anthropometric factors (BMI, AAI, diastolic BP), social/behavioral characteristics (smoking, PCS, GenHlth, VigActiv) and diseases/conditions (hypertension, diabetes, depression, HDL). For CHD after the unadjusted model, the corresponding sequential models were demographic factors (age, sex, race/ethnicity), anthropometric factors (BMI, diastolic BP), social/behavioral characteristics (smoking, PCS, GenHlth, VigActiv) and diseases/conditions (hypertension, diabetes, triglycerides, HDL). Because of the possibility that adjustment for a hypertension and a diabetes indicator would be “overadjustment” (i.e., adjustment for a variable on a causal pathway), we excluded both hypertension and diabetes from the final set of covariates in additional analyses and these are referred to as “parsimonious models.” Lastly, sensitivity analyses were performed in which the natural log of AHI3%A was used instead of categorial levels of that factor in the above models.

Associations between both CVD and CHD, and OSA severity were further analyzed in the subgroup of participants who were not classified as having OSA based on AHI4% criteria but were classified as OSA using AHI3%A criteria. The moderate and severe categories were combined because of the small number of cases in the severe OSA category. Otherwise, the modelling approaches employed were identical.

In Tables 2-5, odds ratios and 95% CI are presented versus the reference level of AHI <5 /hour. P values refer to the overall significance of the model with respect to OSA severity. Odds ratios, 95% CI and P values in Table 6 refer to AHI3%A expressed as the continuous factor lnAHI3%A+0.1 (0.1 added to mitigate 0 values of lnAHI3%A).

Results

Table 1 shows the univariate association of potential risk factors or characteristics with the presence of CVD or CHD.

Table 1. Univariate Association of Various Characteristics to Prevalent Cardiovascular (CVD) and Coronary Heart Disease (CHD)

N=6307 for all characteristics except AHI 3%/A (N=6131)

ap≤0.05; bp≤0.01; cp≤0.001

There were 962 cases (15%) of CVD and 797 (13%) cases of CHD identified. Except for total cholesterol, all were either more prevalent or significantly higher or lower in participants with CVD or CHD. For both CVD and CHD, markedly higher prevalence rates were noted for sex (higher in men), hypertension, diabetes, depression, smoking (higher in ever smokers) and ability to engage in vigorous activity. Conversely, white race and good health status were much less common among those with CVD or CHD. Differences observed for the remaining characteristics were of lesser magnitude.

Figure 1 shows the prevalence rates of CVD or CHD as a function of OSA severity using the AHI3%A criteria. Both conditions were associated with increasing higher rates of disease as OSA became more severe.

Figure 1. Percentage of participants with either cardiovascular (CVD) or coronary heart (CHD) disease according to increasing severity of obstructive sleep apnea defined using a hypopnea definition characterized by a minimum 3% oxygen desaturation or an arousal (AHI3%A)

Table 2 shows the crude and adjusted odds ratios and their 95% confidence intervals for increasing complex models of the relationship between CVD and AHI3%A. The unadjusted model showed a strong, progressive association with increasingly severe OSA. However, as the models became increasingly complex, this relationship was attenuated and only approached statistical significance in the fully adjusted model (+Medical Conditions). Removal of hypertension and diabetes to create the Parsimonious model restored some of the association with a return of statistical significance.

Table 2. Adjusted Relative Odds (95% Confidence Interval) of Self-Reported Prevalent Cardiovascular Disease According to 3% or Arousal Apnea Hypopnea Index Severity Categories

aDemographics model adds age, sex, race (White vs. American Indian)

bAnthropometrics model adds BMI, Ankle Arm Index, diastolic blood pressure

cSocial/Behavioral Factors model adds smoking, SF36 Physical Component Summary, SF36 General Health, SF36 Vigorous Activity

dMedical Conditions model adds hypertension, diabetes, depression and HDL

eParsimonious model includes factors in previous models, but removes hypertension and diabetes

fN=6307

Presented in Table 3 are the models demonstrating the relationship between CHD and AHI3%A.

Table 3. Adjusted Relative Odds (95% Confidence Interval) of Self-Reported Prevalent Coronary Heart Disease According to 3% or Arousal Apnea Hypopnea Index Severity Categoriesf

aDemographics model adds age, sex, race (White vs. American Indian)

bAnthropometrics model adds BMI, diastolic blood pressure

cSocial/Behavioral Factors model adds smoking, SF36 Physical Component Summary, SF36 General Health, SF36 Vigorous Activity

dMedical Conditions model adds hypertension, diabetes, triglycerides and HDL

eParsimonious model includes factors in previous models, but removes hypertension and diabetes

fN=6307

Similar to the findings for CVD, there was a progressively higher odds of having CHD as severity of OSA increased. The fully adjusted model (+Medical Conditions) was not significant, but the Parsimonious model approached statistical significance.

There were 3,326 participants who did not have OSA as defined by AHI4% criteria. Within this cohort, 2247 were classified as OSA using the AHI3%A criteria; 1966 (87.4%) were mild, 271 (12.0%) were moderate and 10 (0.4%) were severe. For this subgroup, Table 4 presents the increasingly complex models illustrating the relationship between the presence of CVD and increasing OSA severity.

Table 4. Adjusted Relative Odds (95% Confidence Interval) of Self-Reported Prevalent Cardiovascular Disease According to 3% or Arousal Apnea Hypopnea Index Severity Categories in Participants Without Obstructive Sleep Apnea According to 4% Desaturation Criteriaf

aDemographics model adds age, sex, race (White vs. American Indian)

bAnthropometrics model adds BMI, Ankle Arm Index, diastolic blood pressure

cSocial/Behavioral Factors model adds smoking, SF36 Physical Component Summary, SF36 General Health, SF36 Vigorous Activity

dMedical Conditions model adds hypertension, diabetes, depression and HDL

eParsimonious model includes factors in previous models, but removes hypertension and diabetes

fN=3326

Because of the relatively small number of cases with severe OSA, the moderate and severe cases were combined for these analyses. The unadjusted model showed a strong relationship with OSA severity; as model complexity increased, this finding was attenuated and only approached statistical significance in both the fully adjusted (+Medical Conditions) and Parsimonious models. As demonstrated in Table 5, similar findings were observed for CHD; the unadjusted model showed a strong association which was attenuated as the models became more complex; the fully adjusted (+medical conditions) and parsimonious models approached statistical significance.

Table 5. Adjusted Relative Odds (95% Confidence Interval) of Self-Reported Prevalent Coronary Heart Disease According to 3% or Arousal Apnea Hypopnea Index Severity Categories in Participants Without Obstructive Sleep Apnea According to 4% Desaturation Criterionf

aDemographics model adds age, sex, race (White vs. American Indian)

bAnthropometrics model adds BMI, diastolic blood pressure

cSocial/Behavioral Factors model adds smoking, SF36 Physical Component Summary, SF36 General Health, SF36 Vigorous Activity

dMedical Conditions model adds hypertension, diabetes, triglycerides and HDL

eParsimonious model includes factors in previous models, but removes hypertension and diabetes

fN=3326

In sensitivity analyses, the natural log of AHI3%A was used as the index of OSA severity in lieu of a categorial representation. As shown in Table 6, in the entire cohort, for both CVD and CHD, a significant linear relationship with increasing severity of OSA was demonstrated in parsimonious models, but not the fully adjusted models. In the subgroup who did not have OSA as defined by AHI4% criteria but did have OSA using the AHI3%A criteria, linear relationships noted for both CVD and CHD in the fully adjusted and parsimonious models. For CHD in the fully adjusted model, the relationship was statistically significant and approached statistical significance in the others.

Table 6. Linear Adjusted Relative Odds (95% Confidence Interval) of Self-Reported Prevalent Cardiovascular and Coronary Heart Disease According to 3% or Arousal Apnea Hypopnea Index Severity

aCohort restricted participants without OSA according to AHI4% criteria, N=3326

bCovariates for CVD: age, sex, race, BMI, ankle-arm index, diastolic blood pressure

smoking, SF36 Physical Component Summary, SF36 General Health, SF36 Vigorous Activity

hypertension, diabetes, depression and HDL; Covariates for CHD: age, sex, race, BMI, diastolic blood pressure,smoking, SF36 Physical Component Summary, SF36 General Health, SF36 Vigorous Activity, hypertension, diabetes, triglycerides and HDL

cExcludes diabetes and hypertension from fully adjusted model

Discussion

In this large community-based study, we demonstrated that OSA defined by apneas and hypopneas characterized by 3% desaturation events or arousals is associated with an increased likelihood of self-reported CVD and CHD after controlling for a number of relevant covariates. Importantly, in a subset of this cohort who did not have OSA as defined by apneas and hypopneas requiring a minimum 4% oxygen desaturation but did have OSA using the 3% desaturation or arousal criteria, we found that the association with both CVD and CHD remained, albeit weaker. Nevertheless, our analyses overall suggest that the regulatory requirement by the Centers for Medicare and Medicaid Services (CMS) in the United States of using a 4% desaturation definition to identify patients with OSA denies a substantial proportion of these individuals the opportunity to be treated for their OSA and thus reduce the risk of worsening or recurrence of their CVD or CHD.

Results from several large cohort studies including SHHS have found that OSA is associated with the presence of CVD and CHD, and that this association is stronger when the AHI as a metric of OSA severity increases (1, 2). These previous studies have used a definition of hypopnea that requires a minimum 4% oxygen desaturation (16-18). This definition has been adopted by CMS and other insurers to identify individuals as having OSA (5). However, the AASM recommends defining hypopneas with a minimum 3% desaturation or an arousal (4). This is based on evidence indicating that daytime sleepiness and other symptoms of OSA are associated with this less stringent definition of OSA (6). This distinction has important clinical implications because there are a large number of patients who do not meet the AHI4% criteria and but do meet the AHI3%A criteria (7, 19). In the former case, they are not considered to have OSA, but do have it in the latter.

To our knowledge, our study is the first to assess the association between OSA using the AHI3%A criteria and CVD and CHD. We found that as OSA severity increased, there was a greater likelihood of having CVD and CHD after adjusting for a number of relevant covariates. We acknowledge that in the fully adjusted model, this association only approached statistical significance. However, in our parsimonious model which removed the presence of hypertension and diabetes, likely mediators of this relationship, the association was strengthened. Sensitivity analyses using the natural log of AHI3%A validated the results we observed with categories of AHI severity. It has been well-established that hypertension and diabetes are independent risk factors for the development of CVD and CHD. However, a number of studies have demonstrated that OSA is a risk factor for the development of both hypertension and diabetes (1, 20). Therefore, both of the latter conditions lie on the causal path by which OSA may increase the risk for the development of CVD and CHD. Hence, we believe that inclusion of both these conditions in our fully adjusted model may be over-adjustment and that our parsimonious model best represents the association between OSA defined by AHI3%A and CVD or CHD.

We identified there was a large subset of our cohort that had OSA using the AHI3%A definition, but not the AHI4% definition of hypopnea. In this subset, we also observed an association between OSA severity and both CVD and CHD. This finding is analogous to the relationship we recently observed between OSA and the prevalence of hypertension (19). Similar to our findings with the full cohort, the fully adjusted model for both CVD and CHD was not statistically significant. However, it approached or became statistically significant in the parsimonious models. Although most of these cases were in the mild OSA category, 12.4% were moderate to severe where treatment is almost always recommended. Individuals with prevalent CVD or CHD and OSA are at risk for further complications of their CVD or CHD (21-23). However, if they do not meet the AHI4% definition of OSA, access to OSA treatment would be denied by CMS and some insurers.

Our findings with respect to CVD and CHD are consistent with recent analyses demonstrating that OSA defined by AHI3%A is associated with prevalent and incident hypertension in the SHHS cohort (19, 24). Similar findings also have been observed in other cohorts providing additional evidence that use of a hypopnea definition incorporating a minimum 3% oxygen desaturation or an arousal is important in the identification of individuals with OSA (25-27).

Although there is substantial evidence emerging that intermittent hypoxemia plays an important role in the cardiovascular consequences of OSA (28), the importance of arousals remains uncertain (29). Arousals involve an increase in the sympathetic activity and a decrease in the parasympathetic activity (28) and there is some evidence linking them in the development of hypertension (30). Data from our study would suggest that they may contribute to the development of CVD or CHD as well.

Some (31, 32), but not all (33) studies have suggested that the impact of OSA on the development of CVD or CHD is in part enhanced by the presence of sleepiness. However, in our initial assessment of potential covariates using a lasso regression, sleepiness did not emerge as a significant factor. Thus, our findings do not support the contention that sleepiness is an important factor impacting the relationship between OSA and CVD or CHD.

Our study does have a few limitations. Most important is that we identified prevalent CVD and CHD by self-report. While it is possible that some misclassification occurred, we do not think it was large. A large number of potential covariates were considered for inclusion in the models; we used a lasso regression to reduce the possibility of over-adjustment and collinearity. Furthermore, the possibility of residual confounding remains. Finally, this is a cross-sectional analysis, and causality cannot be assumed.

This study has several strengths. It uses a large, well characterized cohort with the availability of data from a number of potential covariates. Additionally, the cohort had a diverse racial/ethnic, age and sex distribution. Polysomnography was used to document the presence of OSA, and not more limited sleep apnea testing.

In summary, OSA as defined by apneas and hypopneas requiring a minimum 3% oxygen desaturation or arousal is associated with an increased likelihood of having CVD or CHD. Use of a more restrictive definition requiring a minimum 4% desaturation will misidentify a large number of individuals with OSA, and CVD or CHD. These individuals may be denied access to therapy which may prevent worsening of their underlying CVD or CHD. 

Acknowledgements

SHHS acknowledges the Atherosclerosis Risk in Communities Study, the Cardiovascular Health Study, the Framingham Heart Study, the Cornell/Mt. Sinai Worksite and Hypertension Studies, the Strong Heart Study, the Tucson Epidemiologic Study of Airways Obstructive Diseases (TESAOD), and the Tucson Health and Environment Study for allowing their cohort members to be part of the SHHS and for sharing such data for the purposes of this study. SHHS is particularly grateful to the members of these cohorts who agreed to participate in SHHS as well. SHHS further recognizes all the investigators and staff who have contributed to its success. A list of SHHS investigators, staff, and their participating institutions is available on the SHHS website (www.jhsph.edu/shhs).

The opinions expressed in this paper are those of the authors and do not necessarily reflect the views of the Indian Health Service.

This work was supported by National Heart, Lung and Blood Institute cooperative agreements U01HL53940 (University of Washington), U01HL53941 (Boston University), U01HL53938 (University of Arizona), U01HL53916 (University of California, Davis), U01HL53934 (University of Minnesota), U01HL53931 (New York University), U01HL53937 and U01HL64360 (Johns Hopkins University), U01HL63463 (Case Western Reserve University), U01HL63429 (Missouri Breaks Research).

SP was supported by Patient Centered Outcomes Research Institute (CER-2018C2-13262; PCS-1504-30430; DI-2018C2-13161; DI-2018C2-13161 COVID supplement, EADI-16493), NIH (HL126140, HL151254, AI135108, AG059202, HL158253) and American Academy of Sleep Medicine Foundation during the writing of this manuscript.

Authors’ Declarations: Dr. Budhiraja reports no conflicts of interest or grant funding. Dr. Quan reports research funding from the National Institutes of Health, serves as a consultant to Jazz Pharmaceuticals, Whispersom and is a committee chair and hypopnea taskforce member for the American Academy of Sleep Medicine. Dr. Javaheri serves as a consultant for Jazz Pharmaceuticals and Harmony Biosciences. Dr. Berry reports research funding from Philips Respironics, Res Med and the University of Florida Foundation. Dr. Parthasarathy reports grants from NIH/NHLBI as PI (HL138377, HL126140; IPA-014264-00001; HL095799) or site PI (HL128954; UG3HL140144), grants from Patient Centered Outcomes Research Institute as PI (IHS-1306-02505; EAIN-3394-UOA) or site-investigator (PCS-1504-30430), grants from US Department of Defense as co-investigator (W81XWH-14-1-0570), grants from NIH/NCI as co-investigator (R21CA184920) and NIH/NIMHD as co-investigator (MD011600), grants from Johrei Institute, personal fees from American Academy of Sleep Medicine, non-financial support from National Center for Sleep Disorders Research of the NIH (NHLBI), personal fees from UpToDate Inc., grants from Younes Sleep Technologies, Ltd., personal fees from Vapotherm, Inc., personal fees from Merck, Inc., grants from Philips-Respironics, Inc., personal fees from Philips-Respironics, Inc., personal fees from Bayer, Inc., personal fees from Nightbalance, Inc, personal fees from Merck, Inc, grants from American Academy of Sleep Medicine Foundation (169-SR-17); In addition, Dr. Parthasarathy has a patent UA 14-018 U.S.S.N. 61/884,654; PTAS 502570970 (Home breathing device) issued.

A preprint of this paper is available at: medRxiv, https://doi.org/10.1101/2020.09.22.20199745

Abbreviation List

AHI                             Apnea Hypopnea Index

AHI3%A                     Hypopneas with at least a 3% oxygen desaturation or an arousal

AHI4%                        Hypopneas with at least a 4% oxygen desaturation

AAI                              Ankle arm index

BP                               Blood pressure

BMI                             Body mass index

CHD                           Coronary heart disease

CVD                           Cardiovascular disease

CMS                           Centers for Medicare and Medicaid Services

ESS                            Epworth sleepiness scale

GenHlth                     General health rating subscale of SF36

Glmnet                       A statistical package used in R that fits a generalized linear model via penalized maximum likelihood

HDL                            High density lipoprotein

Lasso                         Least Absolute Shrinkage and Selection Operator

MICE                          Multiple imputation by chained equation

OSA                            Obstructive sleep apnea

PCS                            Physical component summary of the SF36

R                                 An open source programming language used for statistical computing and graphics

SHHS                         Sleep Heart Health Study

VigActiv                     Vigorous activity rating subscale of the SF36

References


  1. Hou H, Zhao Y, Yu W, Dong H, Xue X, Ding J, Xing W, Wang W. Association of obstructive sleep apnea with hypertension: A systematic review and meta-analysis. J Glob Health. 2018 Jun;8(1):010405. [CrossRef] [PubMed]
  2. Mashaqi S, Gozal D. The impact of obstructive sleep apnea and PAP therapy on all-cause and cardiovascular mortality based on age and gender - a literature review. Respir Investig. 2020 Jan;58(1):7-20. [CrossRef] [PubMed]
  3. Berry RB, Budhiraja R, Gottlieb DJ, et al. Rules for scoring respiratory events in sleep: update of the 2007 AASM Manual for the Scoring of Sleep and Associated Events. Deliberations of the Sleep Apnea Definitions Task Force of the American Academy of Sleep Medicine. J Clin Sleep Med. 2012;8(5):597-619. [CrossRef] [PubMed]
  4. Anonymous. CPAP for Obstructive Sleep Apnea. Last Updated: 2020. Accessed: 09/14, 2020. https://www.cms.gov/Medicare/Coverage/Coverage-with-Evidence-Development/CPAP.
  5. Shamin-Uzzaman QA, Singh S, Chowdhuri S. Hypopnea definitions, determinants, and dilemmas: a focused review. Sci Sleep Pract. 2018;2(1):7. [CrossRef]
  6. Raj R, Hirshkowitz M. Effect of the new Medicare guideline on patient qualification for positive airway pressure therapy. Sleep Med. 2003 Jan;4(1):29-33.  
  7. [CrossRef] [PubMed]
  8. Quan SF, Howard BV, Iber C, Kiley JP, Nieto FJ, O'Connor GT, Rapoport DM, Redline S, Robbins J, Samet JM, Wahl PW. The Sleep Heart Health Study: design, rationale, and methods. Sleep. 1997 Dec;20(12):1077-85. [PubMed]
  9. Lind BK, Goodwin JL, Hill JG, Ali T, Redline S, Quan SF. Recruitment of healthy adults into a study of overnight sleep monitoring in the home: experience of the Sleep Heart Health Study. Sleep Breath. 2003;7(1):13-24. [CrossRef] [PubMed]
  10. Iber C, Redline S, Kaplan Gilpin AM, et al. Polysomnography performed in the unattended home versus the attended laboratory setting--Sleep Heart Health Study methodology. Sleep. 2004;27(3):536-540. HTTPS://PUBMED.NCBI.NLM.NIH.GOV/ 15164911 [CrossRef] [PubMed]
  11. Johns MW. A new method for measuring daytime sleepiness: the Epworth sleepiness scale. Sleep. 1991;14(6):540-545. [CrossRef] [PubMed]
  12. Ware JE,Jr, Sherbourne CD. The MOS 36-item short-form health survey (SF-36). I. Conceptual framework and item selection. Med Care. 1992;30(6):473-483. [CrossRef] [PubMed]
  13. O'Connor GT, Caffo B, Newman AB, et al. Prospective study of sleep-disordered breathing and hypertension: the Sleep Heart Health Study. Am J Respir Crit Care Med. 2009;179(12):1159-1164. [CrossRef] [PubMed]
  14. Whitney CW, Gottlieb DJ, Redline S, et al. Reliability of scoring respiratory disturbance indices and sleep staging. Sleep. 1998;21(7):749-757. [CrossRef] [PubMed]
  15. Rechtschaffen A, Kales A. A Manual of Standardized Terminology, Techniques and Scoring System for Sleep Stages of Human Subject. Washington, D.C.: US Government Printing Office, National Institute of Health Publication, 1968.
  16. Marin JM, Carrizo SJ, Vicente E, Agusti AG. Long-term cardiovascular outcomes in men with obstructive sleep apnoea-hypopnoea with or without treatment with continuous positive airway pressure: an observational study. Lancet. 2005 Mar 19-25;365(9464):1046-53. [CrossRef] [PubMed]
  17. Shahar E, Whitney CW, Redline S, et al. Sleep-disordered breathing and cardiovascular disease: cross-sectional results of the Sleep Heart Health Study. Am J Respir Crit Care Med. 2001;163(1):19-25. [CrossRef] [PubMed]
  18. Young T, Finn L, Peppard PE, Szklo-Coxe M, Austin D, Nieto FJ, Stubbs R, Hla KM. Sleep disordered breathing and mortality: eighteen-year follow-up of the Wisconsin sleep cohort. Sleep. 2008 Aug;31(8):1071-8. [PubMed]
  19. Budhiraja R, Javaheri S, Parthasarathy S, Berry RB, Quan SF. The Association Between Obstructive Sleep Apnea Characterized by a Minimum 3 Percent Oxygen Desaturation or Arousal Hypopnea Definition and Hypertension. J Clin Sleep Med. 2019 Sep 15;15(9):1261-1270 [CrossRef] [PubMed]
  20. Qie R, Zhang D, Liu L, Ren Y, Zhao Y, Liu D, Liu F, Chen X, Cheng C, Guo C, Li Q, Zhou Q, Tian G, Han M, Huang S, Wu X, Qin P, Li J, Cao J, Zhang M, Huang J, Lu J, Li H, Wang J, Cheng R, Hu D. Obstructive sleep apnea and risk of type 2 diabetes mellitus: A systematic review and dose-response meta-analysis of cohort studies. J Diabetes. 2020 Jun;12(6):455-464. doi: 10.1111/1753-0407.13017. Epub 2020 Jan 22. [CrossRef] [PubMed]
  21. Yudi MB, Clark DJ, Farouque O, Andrianopoulos N, Ajani AE, Brennan A, Lefkovits J, Freeman M, Hiew C, Selkrig LA, O'Brien J, Dart AM, Reid CM, Duffy SJ; Melbourne Interventional Group. Trends and predictors of recurrent acute coronary syndrome hospitalizations and unplanned revascularization after index acute myocardial infarction treated with percutaneous coronary intervention. Am Heart J. 2019 Jun;212:134-143. [CrossRef] [PubMed]
  22. Lee CH, Khoo SM, Chan MY, Wong HB, Low AF, Phua QH, Richards AM, Tan HC, Yeo TC. Severe obstructive sleep apnea and outcomes following myocardial infarction. J Clin Sleep Med. 2011 Dec 15;7(6):616-21. [CrossRef] [PubMed]
  23. Maia FC, Goulart AC, Drager LF, Staniak HL, Santos IS, Lotufo PA, Bensenor IM. Impact of High Risk for Obstructive Sleep Apnea on Survival after Acute Coronary Syndrome: Insights from the ERICO Registry. Arq Bras Cardiol. 2017 Jan;108(1):31-37. [CrossRef] [PubMed]
  24. Budhiraja R, Javaheri S, Parthasarathy S, Berry RB, Quan SF. Incidence of hypertension in obstructive sleep apnea using hypopneas defined by a 3 percent oxygen desaturation or arousal but not by only 4 percent oxygen desaturation. J Clin Sleep Med. 2020 Jul 9. Epub ahead of print. PMID: 32643602.[CrossRef] [PubMed]
  25. Bouloukaki I, Grote L, McNicholas WT, Hedner J, Verbraecken J, Parati G, Lombardi C, Basoglu OK, Pataka A, Marrone O, Steiropoulos P, Bonsignore MR, Schiza SE; European Sleep Apnoea Database Network. Mild obstructive sleep apnea increases hypertension risk, challenging traditional severity classification. J Clin Sleep Med. 2020 Jun 15;16(6):889-898. [CrossRef] [PubMed]
  26. Hirotsu C, Haba-Rubio J, Andries D, Tobback N, Marques-Vidal P, Vollenweider P, Waeber G, Heinzer R. Effect of Three Hypopnea Scoring Criteria on OSA Prevalence and Associated Comorbidities in the General Population. J Clin Sleep Med. 2019 Feb 15;15(2):183-194. [CrossRef] [PubMed]
  27. Heinzer R, Vat S, Marques-Vidal P, Marti-Soler H, Andries D, Tobback N, Mooser V, Preisig M, Malhotra A, Waeber G, Vollenweider P, Tafti M, Haba-Rubio J. Prevalence of sleep-disordered breathing in the general population: the HypnoLaus study. Lancet Respir Med. 2015 Apr;3(4):310-8. [CrossRef] [PubMed]
  28. Sforza E, Roche F. Chronic intermittent hypoxia and obstructive sleep apnea: an experimental and clinical approach. Hypoxia (Auckl). 2016;499-108. [CrossRef] [PubMed]
  29. Ryan S. Mechanisms of cardiovascular disease in obstructive sleep apnoea. J Thorac Dis. 2018;10(Suppl 34):S4201-S4211. [CrossRef] [PubMed]
  30. Sulit L, Storfer-Isser A, Kirchner HL, Redline S. Differences in polysomnography predictors for hypertension and impaired glucose tolerance. Sleep. 2006;29(6):777-783. [CrossRef] [PubMed]
  31. Kapur VK, Resnick HE, Gottlieb DJ, for the Sleep Heart Health Study Group. Sleep Disordered Breathing and Hypertension: Does Self-Reported Sleepiness Modify the Association? Sleep. 2008;31(8):1127-1132. [CrossRef] [PubMed]
  32. Mazzotti DR, Keenan BT, Lim DC, Gottlieb DJ, Kim J, Pack AI. Symptom Subtypes of Obstructive Sleep Apnea Predict Incidence of Cardiovascular Outcomes. Am J Respir Crit Care Med. 2019;200(4):493-506. [CrossRef] [PubMed]
  33. Ogilvie RP, Lakshminarayan K, Iber C, Patel SR, Lutsey PL. Joint effects of OSA and self-reported sleepiness on incident CHD and stroke. Sleep Med. 2018 Apr;44:32-37. [CrossRef] [PubMed]

Cite as: Quan SF, Budhiraja R, Javaheri S, Parthasarathy S, Berry RB. The Association Between Obstructive Sleep Apnea Defined by 3 Percent Oxygen Desaturation or Arousal Definition and Self-Reported Cardiovascular Disease in the Sleep Heart Health Study. Southwest J Pulm Crit Care. 2020;21(4):86-103. doi: https://doi.org/10.13175/swjpcc054-20 PDF 

Wednesday
Apr292020

Informe de políticas: Fatiga, sueño y salud del personal de enfermería, y cómo garantizar la seguridad de los pacientes y el público

Postura de la Academia Estadounidense de Enfermería sobre políticas

Claire C. Caruso, PhD, RN, FAANa*, Carol M. Baldwin, PhD, RN, CHTP, CT, AHN-BC, FAANa, Ann Berger, PhD, APRN, AOCNS, FAANb, Eileen R. Chasens, PhD, RN, FAANb, James Cole Edmonson, DNP, RN, FACHE, NEA-BC, FAANb, Barbara Holmes Gobel, MS, RN, AOCN, FAANb, Carol A. Landis, PhD, RN, FAANb, Patricia A. Patrician, PhD, RN, FAANb, Nancy S. Redeker, PhD, RN, FAHA, FAANb, Linda D. Scott, PhD, RN, NEA-BC, FAANc, Catherine Todero, PhD, RN, FAANb, Alison Trinkoff, ScD, RN, FAANb, Sharon Tucker, PhD, RN, FAANa

a Panel de expertos en comportamientos relacionados con la salud

b Academia Estadounidense de Enfermería

c Intermediaria del Consejo de la Academia para el panel de expertos en comportamientos relacionados con la salud

Editor's Note: This is a Spanish translation of the original article which was titled "Policy brief: Nurse fatigue, sleep, and health, and ensuring patient and public safety" published in Nursing Oulook. 2019 Sept;65(6):766-8 and is reproduced with the permission of Elsevier.

Resumen ejecutivo

La sociedad necesita servicios de enfermería esenciales a toda hora y, por ende, los enfermeros suelen trabajar por turnos y jornadas laborales extensas. Estos horarios pueden impedir que los enfermeros tengan las siete horas o más a diario de sueño de buena calidad que los expertos recomiendan (Watson, et al., 2015). Los enfermeros que trabajan por turnos y jornadas laborales extensas están en riesgo de tener enfermedad cardiovascular, trastornos gastrointestinales y sicológicos, cáncer, diabetes tipo 2, lesiones, trastornos osteomusculares, mortalidad por cualquier causa, desenlace reproductivo adverso y dificultad para manejar enfermedades crónicas (Caruso, et al., 2017; Caruso & Waters, 2008; Gan, et al. 2015; Gu, et al., 2015; DHHS, 2018; IARC Monographs Vol 124 Group, 2019; NIOSH, et al., 2015; Ramin, et al., 2014; Torquati, et al., 2017). Además, los enfermeros cansados están en riesgo de cometer errores en la atención de los pacientes y de sufrir accidentes vehiculares debido al estado de somnolencia (Bae y Fabry, 2014; Ftouni, et al., 2013; Geiger-Brown, et al., 2012; Geiger-Brown y Trinkoff, 2010; Lee, et al., 2016; Trinkoff, et al., 2011). La presencia del trabajo por turnos y jornadas laborales extensas también está relacionada con problemas de retención e incluso con la expresión por parte de los enfermeros de la intención de dejar o abandonar el trabajo (Hayes, et al., 2012; Moloney, et al., 2018). Estas condiciones han contribuido también a la escasez de enfermeros en ciertas especialidades y lugares de ejercicio de la profesión (Marc, et al., 2018). La escasez es una gran preocupación dado que la población envejece y se proyecta un fuerte aumento de la necesidad de enfermeros (Auerbach, Buerhaus y Staiger, 2017). De este modo, se requieren de manera apremiante intervenciones para reducir la fatiga en la enfermería. La Academia Estadounidense de Enfermería (la Academia) respalda los esfuerzos por reducir la fatiga en los enfermeros mediante educación, políticas en el lugar de trabajo y sistemas de gestión, así como medidas de respuesta a la fatiga. La Academia recomienda que los servicios de atención médica y las entidades normativas establezcan políticas para abordar este peligro generalizado en el lugar de trabajo, y promover así la salud y seguridad de los enfermeros junto con la seguridad de los pacientes y el público.

Antecedentes e importancia

Muchos puestos de enfermería requieren trabajar por turnos y jornadas laborales extensas debido a la necesidad de servicios de enfermería esenciales a toda hora. El trabajo por turnos son horas de trabajo por fuera del horario de lunes a viernes de 7 a. m. a 6 p. m. (Caruso y Rosa, 2007). Las jornadas laborales extensas son turnos con más de ocho horas de trabajo o más de 40 horas de trabajo por semana. Los enfermeros que trabajan por turnos y jornadas laborales extensas están en riesgo de presentar varias enfermedades crónicas, lesiones y desenlaces reproductivos adversos (Caruso, et al. 2017; Caruso y Waters, 2008; Gan, y cols., 2015; Gu, Torquati, et al., 2018).

La evidencia también indica que el trabajo por turnos y jornadas laborales extensas genera mayor desgaste y menos satisfacción laboral entre los enfermeros y contribuye a su escasez (Bae y Fabry, 2014; Geiger-Brown, et al., 2012; Geiger-Brown y Trinkoff, 2010; Trinkoff, et al., 2011). Los investigadores determinaron que los enfermeros que trabajan turnos de 10 horas o más tienen una probabilidad 2.5 veces mayor de reportar desgaste, insatisfacción laboral, reducción del bienestar, así como la intención de renunciar, en comparación con enfermeros que trabajan turnos más cortos (Stimpfel, Sloane y Aiken, 2012). El trabajo por turnos y jornadas laborales extensas seguramente es un factor importante que lleva al 43 % de los nuevos profesionales en enfermería titulados a dejar sus puestos de trabajo en el lapso de tres años (Goodman, 2016).

Los Centros para el Control y la Prevención de Enfermedades (CDC) establecieron que más del 52 % de los trabajadores de atención médica del turno nocturno informaron dormir seis horas o menos por día (CDC, 2012), lo cual es insuficiente de acuerdo con los expertos en sueño (Watson, et al., 2015). La falta de sueño afecta en forma adversa el desempeño de los enfermeros (Bae y Fabry, 2014; Caruso, et al., 2017). En los estudios se notifican efectos adversos en el desempeño de las personas que están despiertas por más de 17 horas que son similares a los de las que tienen un índice de alcoholemia del 0.05 %, y luego de que están despiertas 24 horas con las de un índice de alcoholemia del 0.10 % (Arnedt, et al., 2005; Dawson y Reid, 1997; Williamson y Feyer, 2000). Si bien el nivel legal de intoxicación por alcoholemia para conducir es de 0.08 % en los Estados Unidos, algunos países han establecido un índice de alcoholemia de 0.05 % debido a deficiencias para conducir (NHTSA, 2000). Además, las investigaciones de varios desastres industriales muy conocidos indican que la fatiga del trabajador ha sido uno de los factores causales (Baker Panel, 2007; NTSB, 2004; NTSB, 2009; Rogers Commission, 1986). El trabajo por turnos y jornadas laborales extensas está asociado con mayor insatisfacción de los pacientes, errores en la atención de los pacientes y mortalidad de pacientes (Geiger- Brown y Trinkoff, 2010; Olds y Clarke, 2010; Stimpfel, et al., 2012). Los riesgos para la seguridad se extienden a la familia de los enfermeros, las organizaciones de atención médica y el público cuando los enfermeros cansados cometen errores en el trabajo o el hogar, o se accidentan en sus vehículos debido a la conducción en estado de somnolencia (Bae y Fabry, 2014; Ftouni, et al., 2013; Geiger-Brown, et al., 2012; Geiger-Brown y Trinkoff, 2010; Lee, et al., 2016; Olds y Clarke, 2010; Scott, et al., 2007; Stimpfel, Sloane, y Aiken, 2012; Swanson, Drake y Arnedt, 2012; Trinkoff, et al., 2011).

Actualmente, son pocas las leyes estatales y federales en vigor en los Estados Unidos que atañen a las horas de trabajo de los enfermeros. Ninguna ley federal limita el número de horas que un enfermero puede trabajar ni especifica el diseño de sus horarios laborales. En cambio, en Europa la Directiva de la Unión Europea sobre ordenación del tiempo de trabajo limita las horas trabajadas por semana a 48 (Unión Europea, 2003). Un tercio de los estados prohíben o restringen las horas extras obligatorias para los enfermeros (Asociación de Enfermeros de Ohio, 2018). Estas leyes no contemplan los enfermeros que se ofrecen como voluntarios para trabajar horas extras, si bien las consecuencias para la salud y la seguridad de los enfermeros, así como para la seguridad de los pacientes y el público son similares. Muchas de las leyes en vigor que rigen las horas extras contienen disposiciones de emergencia que se interpretan en forma laxa, con lo cual las entidades invalidan los límites. Adicionalmente, muchos estados no tienen leyes que exijan a los empleadores brindar a los trabajadores pausas para las comidas y el descanso durante los turnos de trabajo (Departamento del Trabajo de los EE. UU.).

Los enfermeros y administradores en las organizaciones de atención médica tal vez no entiendan plenamente los riesgos para la salud y la seguridad que se asocian con la carencia de sueño, la fatiga y el trabajo por turnos y jornadas laborales extensas. Tal vez desconozcan también las estrategias basadas en la evidencia que hay disponibles para reducir estos riesgos (Baldwin, Schultz, y Barrere, 2016; NIOSH, et al., 2015). Sin embargo, la evidencia muestra que es posible limitar o modificar el impacto adverso del trabajo por turnos y jornadas laborales extensas mediante la mejora del sueño y la reducción de la fatiga.

La postura de la Academia

La Academia Estadounidense de Enfermería recomienda que el servicio de atención médica y las entidades normativas implementen políticas que propicien la salud del sueño (DHHS, 2010) de los enfermeros. Estas políticas son esenciales para promover una fuerza de trabajo alerta y sana que esté en mejores condiciones de ofrecer atención de enfermería excelente, a toda hora, y apoyar la capacidad de los enfermeros de mantener su propia salud y seguridad. La Academia respalda los esfuerzos para reducir la fatiga en los enfermeros mediante educación, políticas en el lugar de trabajo y sistemas de gestión, así como medidas de respuesta a la fatiga. Los administradores de atención médica y los enfermeros comparten la responsabilidad de priorizar la salud del sueño en los sistemas de gestión para organizar el trabajo y la vida personal de los enfermeros.

Dada la escasez de personal de enfermería y la demanda creciente por servicios de enfermería, se necesita hacer investigaciones para probar intervenciones que promuevan la capacidad de los enfermeros para brindar atención a toda hora y garantizar la disponibilidad de un número suficiente de enfermeros que brinden atención de alta calidad y satisfagan las necesidades de atención de los pacientes. Además, la Academia respalda el financiamiento para investigaciones sobre la mitigación del riesgo de fatiga de los enfermeros y temas relacionados con el bienestar de los proveedores y la seguridad de los pacientes.

Recomendaciones para los empleadores

Diseño del horario de trabajo. Diseños innovadores para los horarios de trabajo pueden ayudar a reducir la fatiga. Los administradores deben establecer límites a la duración de los turnos, el número de horas y los turnos trabajados por semana, así como al número de turnos consecutivos permitidos. Dado que los riesgos para la salud y la seguridad aumentan con el número de horas de trabajo (Bae y Fabry, 2014), los administradores pueden evitar la implementación de turnos más extensos que 12 horas y usar turnos más cortos, en especial durante las horas de la noche cuando los enfermeros tienen otros desafíos con el sueño y el mantenimiento del estado de alerta (Drake, et al., 2004; Pilcher, Lambert, y Huffcutt, 2000). Si se utilizan rotaciones de turnos, deben ser “hacia adelante” (por ejemplo, de días a tardes, de tardes a noches). Los administradores deben identificar y eliminar las políticas que alienten un número excesivo de horas extras y establecer restricciones sobre la cantidad y el momento en que los enfermeros pueden trabajar horas extras. Más específicamente:

  • Programar turnos nocturnos de no más de 8 horas porque los turnos nocturnos largos conllevan un riesgo mayor de errores en la atención del paciente y de desenlaces adversos para la salud y la seguridad de los enfermeros (Bae y Fabry, 2014; Drake, et al., 2004; Geiger-Brown, et al., 2012; Geiger-Brown y Trinkoff, 2010; Fischer, et al., 2017; Pilcher, Lambert, y Huffcutt, 2000; Trinkoff, , et al., 2011).
  • Diseñar horarios de trabajo con al menos 10 horas continuas o más de descanso por día, de manera que los enfermeros puedan obtener 7 horas o más de sueño por día, conforme recomiendan los expertos para los adultos (Watson, et al., 2015).
  • Examinar los horarios de trabajo futuros de los enfermeros e intervenir para evitar patrones de horarios de trabajo con riesgo alto de fatiga.

Sistemas de gestión del riesgo de fatiga (FRMS, por sus siglas en inglés) (Lerman, et al., 2012). Los empleadores pueden establecer FRMS para brindar un enfoque integral a fin de reducir los riesgos de la fatiga. Los FRMS contribuyen al concepto de "cultura justa" (ANA, 2010), que reconoce que las fallas en los sistemas en el lugar de trabajo suelen ser causas importantes de errores. Los FRMS comprenden varios elementos: 1) institución de políticas en el lugar de trabajo para reducir el riesgo de fatiga; 2) establecimiento de procedimientos para proteger las tareas que son vulnerables a errores relacionados con la fatiga; 3) promoción de educación para administradores y enfermeros; 4) inclusión de factores relacionados con la fatiga en la investigación de incidentes; 5) establecimiento de sistemas anónimos de notificación de cuasiaccidentes e incidentes; 6) abordaje de los trastornos del sueño; y 7) búsqueda de mejoras continuas.

Evitar la conducción en estado de somnolencia. Aumenta la evidencia de que el trabajo por turnos y jornadas laborales extensas, la perturbación de los ritmos circadianos y la falta de sueño incrementan los riesgos de conducir soñoliento y los accidentes vehiculares (Ftouni, et al., 2013; Lee, et al., 2016; Scott, et al., 2007; Swanson, Drake y Arnedt, 2012). Scott et al. destacaron la necesidad de aumentar la concientización de los enfermeros y de establecer sistemas de gestión para evitar la conducción en estado de somnolencia para fines de seguridad de los enfermeros y el público (Scott, et al. 2007). Los administradores deben organizar campañas educativas y establecer procedimientos para el transporte de los enfermeros que estén demasiado cansados para conducir al hogar en forma segura (NIOSH, et al., 2015). Por ejemplo, los administradores pueden suministrar un servicio de taxi o llamar a un familiar para brindar transporte. Otra opción es disponer de habitaciones para que duerman los enfermeros cansados en proximidades del lugar de trabajo.

Sistemas para emergencias Durante las emergencias ambientales u otros desastres, los gerentes deben establecer sistemas de apoyo a la gestión para aumentar la capacidad de los enfermeros de seguir trabajando. Estos sistemas podrían incluir servicios que reduzcan las tareas no laborales en los enfermeros de manera que puedan dedicar su tiempo libre a descansar y dormir. Algunos ejemplos comprenden ofrecer habitaciones para dormir en el lugar, cuidado de niños y lavandería para los uniformes. Durante estas situaciones, los administradores deben evitar presionar a los enfermeros para que trabajen horas extras dado que los turnos más largos están asociados con un mayor número de errores y lesiones, así como con el desgaste. 

Otras recomendaciones 

Educación. Los enfermeros y sus administradores deben recibir educación sobre los riesgos para la salud, y la seguridad del trabajo por turnos y jornadas laborales extensas, así como sobre las estrategias basadas en la evidencia que pueden reducir estos riesgos. El Instituto Nacional para la Seguridad y Salud Ocupacional (NIOSH) ofrece un curso de capacitación en línea, gratuito e integral, titulado, Capacitación de NIOSH para enfermeros que trabajan por turnos y jornadas laborales extensas (NIOSH, et al., 2015). Otro recurso es la Declaración sobre la postura de la Asociación Estadounidense de Enfermeros, que aborda la fatiga de los enfermeros para promover la seguridad y la salud: Responsabilidades conjuntas de los profesionales en enfermería titulados y de los empleadores para reducir el riesgo (ANA, 2014). Además, debe incluirse contenido sobre los principales trastornos del sueño y su tratamiento, los riesgos para la seguridad de los enfermeros y los pacientes a raíz de la fatiga en relación con los trastornos del sueño y el trabajo por turnos y jornadas laborales extensas, así como estrategias para reducir los riesgos, en los currículos de enfermería de carrera corta, universitario y de posgrado.

Medidas de respuesta

Estas son estrategias para reducir la somnolencia y la fatiga. Comprenden siestas cortas y pausas para descanso durante el turno de trabajo, y el consumo razonable de cafeína. Las organizaciones de atención médica deben establecer políticas que dispongan pausas para descanso de 10 a 15 minutos durante los turnos cada 2 horas, y pausas adicionales para las comidas a fin de reducir el riesgo de fatiga, errores y lesiones (Fischer, et al., 2017). Los administradores también pueden crear horarios con tiempo para siestas breves planeadas durante los turnos de trabajo: las investigaciones indican que las siestas breves (entre 15 y 30 minutos) aumentan el grado de alerta durante los turnos de trabajo (Geiger-Brown, et al., 2016; Scott, et al., 2010). Otra medida de respuesta bien fundamentada es el consumo de pequeñas cantidades de cafeína teniendo cuidado de que el momento sea oportuno (NIOSH, et al., 2015). Adicionalmente, los empleadores deben trabajar para establecer procedimientos no punitivos para los enfermeros que estén demasiado fatigados para trabajar, como un plan de dotación de personal de reserva. Finalmente, las investigaciones de incidentes de las juntas estatales de enfermería deben incluir detalles sobre las horas de trabajo y los factores relacionados con el sueño que ocurrieron 3 días o más antes del error a fin de identificar los elementos que contribuyeron al incidente (Lerman, et al., 2012).

Agradecimientos

Los hallazgos y las conclusiones que aparecen en este informe pertenecen a los autores y no reflejan necesariamente la postura oficial del Instituto Nacional para la Seguridad y Salud Ocupacional, Centros para el Control y la Prevención de Enfermedades. Este artículo fue traducido y certificado por los Servicios Multilingües de los CDC (Centros para el Control y la Prevención de Enfermedades).

*Autora para la correspondencia: Claire C. Caruso, National Institute for Occupational Safety and Health, Centers for Disease Control and Prevention, 1090 Tusculum Avenue MS C-24, Cincinnati, OH 45226

Dirección de correo electrónico: ccaruso@cdc.gov (C.C. Caruso).

Publicado por Elsevier Inc. https://doi.org/10.1016/j.outlook.2019.08.004

Referencias

American Nurses Association (2010). Position statement: Just culture. Retrieved from https://www.nursingworld.org/»4afe07/globalassets/practiceandpolicy/health-and-safety/just_culture.pdf.

American Nurses Association (2014). Addressing nurse fatigue to promote safety and health: joint responsibilities of registered nurses and employers to reduce risk. Retrieved from https://www.nursingworld.org/»4afdfc/globalas sets/practiceandpolicy/health-and-safety/nursefatigue- position-statement-final.pdf .

Arnedt, J. T., Owens, J., Crouch, M., Stahl, J., & Carskadon, M. A. (2005). Neurobehavioral performance of residents after heavy night call vs after alcohol ingestion. JAMA, 294, 1025–1033.

Auerbach, D. I., Buerhaus, P. I., & Staiger, D. O. (2017). How fast will the registered nurse workforce grow through  2030? Projections in nine regions of the country. Nurs Outlook, 65, 116–122, doi:10.1016/j.outlook.2016.07.004 Epub 2016 Jul 13.

Bae, S. H., & Fabry, D. (2014). Assessing the relationships between nurse work hours/overtime and nurse and patient outcomes: systematic literature review. Nurs Outlook, 62, 138–156.

Baker Panel (2007). The report of the BP U.S. refineries independent safety review panel. Retrieved from https://www.csb.gov/bp-america-refinery-explosion/.

Baldwin, C. M., Schultz, A. A., & Barrere, C. C. (2016). Evidence- based practice (pp. 637_659). In B. M. Dossey, & L. Keegan (Eds.), Holistic nursing: a handbook for practice (7th ed.). Burlington, MA: Jones & Bartlett.

Caruso, C. C., Baldwin, C. M., Berger, A., Chasens, E. R., Landis, C., Redeker, N. S., et al. (2017). Position statement: Reducing fatigue associated with sleep deficiency and work hours in nurses. Nurs Outlook, 65, 766– 768.

Caruso, C. C., & Rosa, R. R. (2007). Shift work and long work hours. In W. N. Rom (Ed.), Environmental and Occupational Medicine, Chapter 90 (4th ed.). (pp. 1359_1363). Philadelphia: Lippincott Williams & Wilkins.

Caruso, C. C., &Waters, T. R. (2008). A review of work schedule issues and musculoskeletal disorders with an emphasis on the health care sector. Indust Health, 46, 523–534.

Centers for Disease Control and Prevention (CDC). (2012). Short sleep duration among workers—United States, 2010. MMWR, 61, 281–285.

Dawson, D., & Reid, K. (1997). Fatigue, alcohol and performance impairment. Nature, 388, 235.

Drake, C. L., Roehrs, T., Richardson, G., Walsh, J. K., & Roth, T. (2004). Shift work sleep disorder: prevalence and consequences beyond that of symptomatic day workers. Sleep, 27, 1453–1462.

European Union. (2003). Directive 2003/88/EC of the European Parliament and of the Council of 4 November 2003 concerning certain aspects of the organisation of working time. Retrieved from http://eur-lex.europa.eu/LexUriServ/LexUriServ.do?uri=CELEX:32003L0088:EN:HTML.

Fischer, D., Lombardi, D. A., Folkard, S., Willetts, J., & Christiani, D. C. (2017). Updating the "Risk Index": A systematic review and meta-analysis of occupational injuries and work schedule characteristics. Chronobiol Int, 34, 1423–1438, doi:10.1080/07420528.2017.1367305.

Ftouni, S., Sletten, T. L., Howard, M., Anderson, C., Lenne, M. G., Lockley, S. W., & Rajaratnam, S. M. (2013). Objective and subjective measures of sleepiness, and their associations with on-road driving events in shift workers. J Sleep Res, 22, 58–69.

Gan, Y., Yang, C., Tong, X., Sun, H., Cong, Y., Yin, X., Li, L., Cao, S., Dong, X., Gong, Y., Shi, O., Deng, J., Bi, H., & Lu, Z. (2015). Shift work and diabetes mellitus: a metaanalysis of observational studies. Occup Environ Med, 72, 72–78, doi:10.1136/oemed-2014-102150.

Geiger-Brown, J., Rogers, V. E., Trinkoff, A. M., Kane, R. L., Bausell, R. B., & Scharf, S. M. (2012). Sleep, sleepiness, fatigue, and performance of 12-hour-shift nurses. Chronobiol Int, 29, 211–219.

Geiger-Brown, J., Sagherian, K., Zhu, S., Wieroniey, M. A., Blair, L., Warren, J., Hinds, P. S., & Szeles, R. (2016). Napping on the night shift: a two-hospital implementation project. Am J Nurs, 116, 26–33.

Geiger-Brown, J., & Trinkoff, A. M. (2010). Is it time to pull the plug on 12-hour shifts? The evidence. J Nurs Adm, 40, 100–102.

Goodman, A. (2016). Nurse turnover rate infographic. Streamline Verify. Retrieved from https://www.streamlineverify.com/nurse-turnover-rate/.

Gu, F., Han, J., Laden, F., Pan, A., Caporaso, N. E., Stampfer, M. J., Kawachi, I., Rexrode, K. M., Willett, W. C., Hankinson, S. E., Speizer, F. E., & Schernhammer, E. S. (2015). Total and cause-specific mortality of U.S. nursing working rotating night shifts. Am J Prev Med, 48, 241–252.

Hayes, L. J., O’Brien-Pallas, L., Duffield, C., Shamian, J., Buchan, J., Hughes, F., Laschinger, H. K., & North, N. (2012). Nurse turnover: A literature review. An update. Int J Nurs Studies, 49, 887–905, doi:10.1016/.ijnurstu. 2011.10.001.

IARC Monographs Vol 124 Group. (2019). Carcinogenicity of night shift work. Lancet Oncol, 20, doi:10.1016/S1470- 2045(19)30455-3 online July 4.

Lee, M. L., Howard, M. E., Horrey, W. J., Liang, Y., Anderson, C., Shreeve, M. S., O’Brien, C. S., & Czeisler, C. A. (2016). High risk of near-crash driving events following night-shift work. Proc Natl Acad Sci, 113, 176–181, doi:10.1073/pnas.1510383112.

Lerman, S. E., Eskin, E., Flower, D. J., George, E. C., Gerson, B., Hartenbaum, N., Hursh, S. R., Moore- Ede, M., & American College of Occupational and Environmental Medicine Presidential Task Force on Fatigue Risk Management. (2012). Fatigue risk management in the workplace. J Occup Environ Med, 54, 231–258.

Mar_c, M., Bartosiewicz, A., Burzy_nska, J., Chmiel, Z., & Januszewicz, P. (2018). A nursing shortage: A prospect of global and local policies. Int Nurs Rev, doi:10.1111/ inr.12473 Jul 24, Epub ahead of print.

Moloney, W., Boxall, P., Parsons, M., & Cheung, G. (2018). Factors predicting Registered Nurses’ intentions to leave their organization and profession: A job demands-resources framework. J Adv Nurs, 74, 864– 875, doi:10.1111/jan.13497 Epub 2017 Dec 5.

National Highway Traffic Safety Administration (2000). On DWl laws in other countries. Retrieved from http://www.nhtsa.gov/people/injury/research/pub/DWIothercountries/dwiothercountries.html.

NIOSH, Caruso, C. C., Geiger-Brown, J., Takahashi, M., Trinkoff, A., & Nakata, A. (2015). NIOSH training for nurses on shift work and long work hours. (DHHS (NIOSH) Publication No. 2015-115). Cincinnati, OH: US Department of Health and Human Services, Centers for Disease Control and Prevention, Cincinnati, OH: National Institute for Occupational Safety and Health. Retrieved from https://www.cdc.gov/niosh/docs/2015-115/.

National Transportation Safety Board (NTSB). (2004). Grounding of U.S. Tank ship Exxon Valdez on Bligh Reef, Prince William Sound, Near Valdez, Alaska, March 04 1989. NTSB/ MAR-90/04.Washington, DC: NTSB.

National Transportation Safety Board. (2009). Aircraft Accident Report: loss of control on approach, Colgan Air, Inc., operating as Continental connection flight 3407, Bombardier DHC-8-400, N200WQ, Clarence Center, New York, February 12, 2009.Washington, DC: NTSB. Retrieved from http://www.ntsb.gov/investigations/AccidentReports/ Reports/AAR1001.pdf.

Ohio Nurses Association. (2018). House Bill 456/Prohibit Mandatory Overtime Passes House. Retrieved from http://ohnurses.org/house-bill-456-prohibit-manda tory-overtime-passes-house/.

Olds, D. M., & Clarke, S. P. (2010). The effect of work hours on adverse events and errors in health care. J Safety Res, 41, 153–162.

Pilcher, J. J., Lambert, B. J., & Huffcutt, A. I. (2000). Differential effects of permanent and rotating shifts on self-report sleep length: a meta-analytic review. Sleep, 23, 155–163.

Ramin, C., Devore, E. E., Wang, W., Pierre-Paul, J., Wegrzyn, L. R., & Schemhammer, E. S. (2015). Night shift work at specific age ranges and chronic disease risk factors. Occup Environ Med, 72, 1000–1007.

Rogers Commission. (1986). Report of the Presidential Commission on the Space Shuttle Challenger Accident. Volume II. Appendix G.Washington, DC: U.S. Government Printing Office.

Scott, L. D., Hofmeister, N., Rogness, N., & Rogers, A. E. (2010). An interventional approach for patient and nurse safety: a fatigue countermeasures feasibility study. Nurs Res, 59, 250–258.

Scott, L. D., Hwang, W. T., Rogers, A. E., Nysse, T., Dean, G. E., & Dinges, D. F. (2007). The relationship between nurse work schedules, sleep duration, and drowsy driving. Sleep, 30, 1801–1807.

Stimpfel, A. W., Sloane, D. M., & Aiken, L. H. (2012). The longer the shifts for hospital nurses, the higher the levels of burnout and patient dissatisfaction. Health Affairs (Millwood), 31, 2501–2509.

Swanson, L. M., Drake, C., & Arnedt, J. T. (2012). Employment and drowsy driving: a survey of American workers. Behav Sleep Med, 20, 250–257.

Torquati, L., Mielke, G. I., Brown, W. J., & Kolbe- Alexander, T. (2018). Shift work and the risk of cardiovascular disease. A systematic review and meta-analysis including dose-response relationship. Scand J Work Environ Health, 44, 229–238, doi:10.5271/sjweh.3700.

Trinkoff, A. M., Johantgen, M., Storr, C. L., Gurses, A. P., Liang, Y., & Han, K. (2011). Nurses’ work schedule characteristics, nurse staffing, and patient mortality. Nurs Res, 60, 1–8.

U.S. Department of Health and Human Services, Office of Disease Prevention and Health Promotion (2010). Healthy People 2020: Sleep Health. Retrieved from http://www.healthypeople.gov/2020/topics-objectives/topic/sleep-health.

U.S. Department of Labor (ND). State labor laws. Retrieved from http://www.dol.gov/whd/state/state.html.

Watson, N. F., Badr, M. S., Belenky, G., et al. (2015). Recommended amount of sleep for a healthy adult: a joint consensus statement of the American Academy of Sleep Medicine and Sleep Research Society. J Clin Sleep Med, 11, 591–592.

Williamson, A. M., & Feyer, A. M. (2000). Moderate sleep deprivation produces impairments in cognitive and motor performance equivalent to legally prescribed levels of alcohol intoxication. Occup Environ Med, 57, 649–655.           

Cite as: Caruso CC, Baldwin CM, Berger A, Chasens ER, Edmonson JC, Gobel BH, Landis CA, Patrician PA, Redeker NS, Scott LD, Tordero C, Trinkoff A, Tucker S. Informe de políticas: Fatiga, sueño y salud del personal de enfermería, y cómo garantizar la seguridad de los pacientes y el público. Southwest J Pulm Crit Care. 2020;20(4):137-47. doi: https://doi.org/10.13175/swjpcc031-20 PDF 

Monday
Apr062020

Sleep Tips for Shift Workers in the Time of Pandemic

Heidi M. Lammers-van der Holst, PhD

Audra S. Murphy, BS

John Wise, BS

Jeanne F. Duffy, MBA, PhD

Division of Sleep and Circadian Disorders

Department of Medicine

Brigham and Women’s Hospital

Boston, MA USA

Sleep is more important now than ever. 

Getting enough sleep is a challenge for those who work nights even in the best of times, because our bodies are designed to be at rest during the night and awake and active during the day. Whether you are an experienced shift worker or new to shift work, the added stress from the COVID-19 pandemic has likely made sleep even more challenging over the past weeks. 

Sleep does more than just make us feel better the next day. It allows us to pay close attention, remember new information, and multi-task. Over the long term, insufficient sleep can also impair our health, weakening our immune system, increasing inflammation, and leading to increased vulnerability to viral illnesses. Given how important sleep is for our safety, health, and quality of life, the following tips are designed to help those who work at night sleep their best.

Sleep tips for night shift workers.

  • Plan for sleep! Build time for sleep into your daily schedule, and try to keep your sleep schedule the same each day as you work a series of night, evening, or day shifts.  
  • If you are on permanent nights, try to keep regularity in your sleep patterns even on days off.
  • When working nights, try to shift your sleep so you wake up close to the start of the next night shift, rather than going to sleep as soon as you get home in the morning. Alternatively, split your sleep so that you sleep for a few hours when you get home in the morning and then take an extended nap that ends just before you have to go back to work the next night.
  • Improve your sleep environment; keep your bedroom cool, dark, and quiet. Use an eye mask or blackout shades, and wear earplugs or try a white noise machine or app. If you live with family or roommates, let them know when your sleep times are so they can try not to disturb you.
  • If you have to keep your phone with you while sleeping, avoid checking it if you wake during your sleep episode.
  • If you are sleeping in a new environment, try to make it as comfortable as possible. Bring your pillow, favorite pajamas, slippers, etc. from home to make your new environment as comfortable and sleep-friendly as possible.
  • Practice a soothing pre-bedtime routine, such as taking a warm shower or writing down stresses from your day; this will help you to unwind and tell your body ‘it’s time to sleep’.
  • Use caffeine (coffee, cola, energy drinks) at the beginning of your shift, but avoid caffeine 3-4 hours before you want to go to sleep.
  • Avoid alcohol before bedtime. While it might help you fall asleep, it will reduce the quality of your sleep and may make it more likely that you wake up early. 
  • Melatonin may help promote daytime sleep, but should be taken carefully because at the wrong time it may worsen sleep problems. Seek the advice of a sleep specialist for when and how much melatonin to take, and where best to obtain it.

Sleep, alertness, and safety for night shift workers.

  • Shift workers are at high risk for having a drowsy driving accident while commuting (especially when commuting home in the morning after a night shift). Consider taking a short nap in your car before heading home. If you are driving and begin to feel drowsy, pull into a rest area or parking lot and take a short nap before continuing.
  • Be aware that if you are new to shift work, or you are working longer hours than usual, you may be more likely than usual to make an error or have an accident while at work.
  • While you are at work, try using small amounts of caffeine every 1-2 hours to help remain alert. This can be more effective than a large amount of caffeine only once or twice per shift.
  • A short bout of exercise can make you feel more alert for the next hour or so.
  • If possible, take a short (15-20 minutes or so) nap during your break time.
  • Try a “coffee nap”! If you are very sleepy, drink a coffee (or other caffeinated drink) and immediately take a short (15-20 minutes) nap. By the time you wake up, the caffeine will have had a chance to act, and combined with the nap it should keep you going for the next couple of hours.

Additional information and help.

The authors are supported by grant R01 AG044416 from the National Institutes of Health.

Cite as: Lammers-van der Holst HM, Murphy AS, Wise J, Duffy JF. Sleep tips for shift workers in the time of pandemic. Southwest J Pulm Crit Care. 2020;20(4):128-30. doi: https://doi.org/10.13175/swjpcc024-20 PDF