Search Journal-type in search term and press enter
Southwest Pulmonary and Critical Care Fellowships
In Memoriam

Sleep

(Click on title to be directed to posting , most recent listed first)

July 2023 Sleep Case of the Month: Fighting for a Good Night’s Sleep
Associations Between Insomnia and Obstructive Sleep Apnea with
   Nutritional Intake After Involuntary Job Loss
January 2023 Sleep Case of the Month: An Unexpected EEG Abnormality
July 2022 Sleep Case of the Month: A Sleepy Scout
Assessing Depression and Suicidality Among Recently Unemployed
   Persons with Obstructive Sleep Apnea and Socioeconomic
   Inequality
Impact of Recent Job Loss on Sleep, Energy Consumption and Diet
Long-term All-Cause Mortality Risk in Obstructive Sleep Apnea Using
   Hypopneas Defined by a ≥3 Percent Oxygen Desaturation or Arousal
The Association Between Obstructive Sleep Apnea Defined by 3 Percent
   Oxygen Desaturation or Arousal Definition and Self-Reported
Cardiovascular Disease in the Sleep Heart Health Study
Informe de políticas: Fatiga, sueño y salud del personal de enfermería, y 
   cómo garantizar la seguridad de los pacientes y el público
Sleep Tips for Shift Workers in the Time of Pandemic
Tips for Circadian Sleep Health While Working from Home
Impacto del Sueño y la Modalidad de Diálisis sobre la Calidad de Vida en
   una Población
The Effect of CPAP on HRQOL as Measured by the Quality of Well-Being
   Self-Administered Questionnaire (QWB-SA)
Declaración de posición: Reducir la fatiga asociada con la deficiencia de 
   sueño y las horas de trabajo en enfermeras
Impact of Sleep and Dialysis Mode on Quality of Life in a Mexican Population
Out of Center Sleep Testing in Ostensibly Healthy Middle Aged to Older
   Adults
Sleep Related Breathing Disorders and Neurally Mediated Syncope (SRBD
   and NMS)
Sleep Board Review Question: Restless Legs
Impact of Sleep Duration and Weekend Oversleep on Body Weight
   and Blood Pressure in Adolescents
Role of Spousal Involvement in Continuous Positive Airway Pressure
   (CPAP) Adherence in Patients with Obstructive Sleep Apnea (OSA)
The Impact of an Online Prematriculation Sleep Course (Sleep 101) on
   Sleep Knowledge and Behaviors in College Freshmen: A Pilot Study
Obstructive Sleep Apnea and Quality of Life: Comparison of the SAQLI,
   FOSQ, and SF-36 Questionnaires
Gender Differences in Real-Home Sleep of Young and Older Couples
Brief Review: Sleep Health and Safety for Transportation Workers
Lack of Impact of Mild Obstructive Sleep Apnea on Sleepiness, Mood and
   Quality of Life
Alpha Intrusion on Overnight Polysomnogram
Sleep Board Review Question: Insomnia in Obstructive Sleep Apnea
Long-Term Neurophysiologic Impact of Childhood Sleep Disordered 
   Breathing on Neurocognitive Performance
Sleep Board Review Question: Hyperarousal in Insomnia
Sleep Board Review Question: Epilepsy or Parasomnia?
Sleep Board Review Question: Nocturnal Hypoxemia in COPD
Sleep Board Review Questions: Medications and Their
   Adverse Effects
Sleep Board Review Questions: The Restless Sleeper
Obstructive Sleep Apnea and Cardiovascular Disease:
Back and Forward in Time Over the Last 25 Years
Sleep Board Review Questions: The Late Riser
Sleep Board Review Questions: CPAP Adherence in OSA
Sleep Board Review Questions: Sleep Disordered Breathing 
That Improves in REM
The Impact Of Sleep-Disordered Breathing On Body
   Mass Index (BMI): The Sleep Heart Health Study (SHHS)
Incidence and Remission of Parasomnias among Adolescent Children in the 
   Tucson Children’s Assessment of Sleep Apnea (TuCASA) Study 
A 45-Year Old Man with Excessive Daytime Somnolence, 
   and Witnessed Apnea at Altitude


The Southwest Journal of Pulmonary and Critical Care and Sleep publishes articles related to those who treat sleep disorders in sleep medicine from a variety of primary backgrounds, including pulmonology, neurology, psychiatry, psychology, otolaryngology, and dentistry. Manuscripts may be either basic or clinical original investigations or review articles. Potential authors of review articles are encouraged to contact the editors before submission, however, unsolicited review articles will be considered.

-------------------------------------------------------------------------------------

Thursday
Apr062017

The Impact of an Online Prematriculation Sleep Course (Sleep 101) on Sleep Knowledge and Behaviors in College Freshmen: A Pilot Study

Stuart F. Quan, M.D.

Pallas Snider Ziporyn, A.B.


Division of Sleep and Circadian Disorders

Brigham and Women’s Hospital

Boston, MA USA


Abstract

College students have a high prevalence of poor sleep quality and sleep deficiency which negatively impacts their academic, mental and physical performance. A prematriculation course focused on improving sleep knowledge and behaviors may reduce sleep problems. “Sleep 101” is an online prematriculation course developed to educate incoming college freshmen about the importance of sleep in their lives and to recommend behaviors that will improve their sleep health. In a pilot program, “Sleep 101” was administered to freshman at four universities. The results of a voluntary survey after completion of the course indicated that there was an improvement in knowledge about sleep and the effects of caffeine use, and that students were less likely to drive drowsy and pull “all-nighters,” These pilot data suggest that an internet administered prematriculation course on the importance of sleep and the adoption of healthy sleep behaviors will be effective in reducing sleep problems among college students.

Introduction

Poor sleep hygiene among college students is common (1). Not surprisingly, there is a high prevalence of sleep problems (2). Sleep deficiency in college students has been linked to poor academic and physical performance, depression, accident risk, excessive caffeine and stimulant medication use, impairment in social relationships and worse overall health (3-5). Unfortunately, unlike the efforts to reduce the use of alcohol and sexual misconduct on campuses, there has been relatively little attention paid to poor sleep health and its impact on individual health and performance.

Although there have been a few studies using in-person educational programs to improve sleep knowledge and behaviors, the impact of these have been inconsistent and in most cases limited to small numbers of students. Over the past 15 years, internet usage among college students has become ubiquitous (6). Thus, a sleep educational program delivered over the internet has the potential to reach large numbers of students. In a recent study, we demonstrated that an internet-based sleep learning module administered as component to an introductory college psychology course resulted in an improvement in sleep knowledge and changes in sleep habits (7). In an effort to provide a more comprehensive sleep educational intervention, we have developed an interactive internet-based sleep course, “Sleep 101.” The course is intended to be administered to matriculating freshmen in order improve their sleep knowledge and to prevent the development of poor sleep habits with their resultant adverse impacts on academic and physical performance, and personal health. This report describes the result of the “Sleep 101” pilot program at four universities.

Methods

In the fall of 2016, freshmen at four universities were asked to complete a pilot online educational course, “Sleep 101,” on the importance of obtaining sufficient sleep in their college lives. At two of the universities, the students were informed that completion of the course was required although there was no penalty for non-completion. At the other two universities, the students were required to take the course as part of a freshman seminar series. At the end of the course, a voluntary brief survey was administered to assess students’ opinion of the course, to obtain data regarding ease of course navigation and to identify any “software bugs.” One of the universities is located in the Midwest and has a total enrollment of approximately 6000 undergraduates. The other three universities are located on the East Coast. Two have undergraduate enrollments of approximately 4000 students and the other has an undergraduate enrollment of approximately 6700 students. All are private coeducational institutions.

The content of Sleep 101 includes material related to basic sleep physiology, the impact of sleep on mood, academic and physical performance, the impact of sleep deficiency on driving and personal health, the interactions among sleep and various substances including alcohol and caffeine and a review of common sleep disorders. The curriculum was developed in Articulate Storyline 2 and uses engaging video clips of actual students and sleep experts, interactive activities and text. Selected images from the course can be viewed by clicking the following link [Sleep 101 Slides].At the end of the course, colleges have the option of including custom links to health resources at their university. The program is designed to be completed in 45-60 minutes. A link to the course is available upon request to one of the authors.

Results

The Table shows aggregate and institutional response to four knowledge and behavior questions related to sleep:

  • knowing more about sleep;
  • knowing more about the effects of caffeine;
  • the likelihood of “pulling an all-nighter”;
  • the likelihood of driving drowsy.

In the aggregate results as well as for each institution, over three quarters of the students responded that they knew more about sleep and the effects of caffeine. In addition, nearly half indicated that they were less likely to stay up all night studying. Importantly, 60% of respondents indicated that they were less likely to drive when drowsy. When asked whether the course was easy to use, there were no major navigational issues.

Discussion

The results of this pilot study demonstrate that “Sleep 101” improved students’ knowledge about sleep and the effects of caffeine. In addition, they were less likely to “pull an all-nighter” and drive when drowsy. The data suggest that our course has the potential to improve the sleep of college students and ultimately their school performance and college experience.

Sleep in college students is notoriously poor. When deciding whether to sleep, study or socialize, most students will choose the latter two activities. The impact of poor sleep is broad. Sleep deficiency negatively affects academic and physical performance. There are impairments in mood and social relationships (8). Furthermore, reduced sleep is a risk factor for cardiac disease, hypertension, stroke and type 2 diabetes (9). To mitigate the effects of sleep deficiency, many students increase caffeine consumption and some use stimulating medications such as amphetamine and dextroamphetamine (Adderall) (10, 11). Both can potentially have an adverse impact on health. Thus, interventions to improve sleep health can potentially have a major impact on the health and well-being of college students.

Our pilot data indicate that a pre-matriculation curriculum focused on good sleep health can have a positive impact by improving knowledge concerning the importance of sleep and reducing behaviors that adversely affect sleep. Thus, the results are consistent with our previous study demonstrating a positive impact on sleep knowledge and behavior in a group of undergraduates enrolled in an introductory psychology course using an internet-based educational module (7).  In addition, Kloss et al reported improvements in sleep hygiene knowledge and sleep quality four weeks after an in-person sleep educational intervention (12). However, not all previous studies have been so encouraging. No difference in sleep hygiene knowledge was noted between sleep education and control groups after six weeks by Brown et al. (13). Similarly, no changes in sleep quality were reported by Clark et al and Lamberti et al. (14, 15). Explanations for these inconsistencies are unclear, but there were significant differences in the curriculum and the methods of content presentation, and the number of participating students was small in most of the studies.

“Sleep 101” was developed as an e-learning course to be taken online. Other sleep education programs in college students used in-person delivery of content (12-15). However, use of the internet will provide much greater scalability than in-person delivery. The latter will be logistically difficult and costly for universities with large enrollments.

Although promising, our data must be interpreted as preliminary. Not all students finished the course and completion of the survey was voluntary as well. Thus, a selection bias towards those who had an interest in improving their sleep was likely. In addition, the pilot universities had relatively small enrollments. Nevertheless, our feedback suggests that a sleep intervention for college students delivered through the internet such as “Sleep 101” is feasible and effective. The results provide an impetus for its dissemination to additional universities nationwide.

Acknowledgements

“Sleep 101” was developed as a collaboration between the Brigham Sleep Health Institute and the non profit Healthy Hours. Funding was provided by the Snider Family Fund.

References

  1. Buboltz WC Jr, Brown F, Soper B. Sleep habits and patterns of college students: a preliminary study. J Am Coll Health. 2001 Nov;50(3).:131-5. [CrossRef] [PubMed]
  2. Forquer LM, Camden AE, Gabriau KM, Johnson CM. Sleep patterns of college students at a public university. J Am Coll Health. 2008 Mar-Apr;56(5).:563-5. [CrossRef] [PubMed]
  3. Gaultney JF. The prevalence of sleep disorders in college students: impact on academic performance. J Am Coll Health. 2010;59(2).:91-7. [CrossRef] [PubMed]
  4. Brown FC, Buboltz WC Jr, Soper B. Relationship of sleep hygiene awareness, sleep hygiene practices, and sleep quality in university students. Behav Med. 2002 Spring;28(1).:33-8. [CrossRef] [PubMed]
  5. Hershner SD, Chervin RD. Causes and consequences of sleepiness among college students. Nat Sci Sleep. 2014 Jun 23;6:73-84. [CrossRef] [PubMed]
  6. Melton BF, Bigham LE, Bland HW, Bird M, Fairman C. Health-related behaviors and technology usage among college students. Am J Health Behav. 2014 Jul;38(4).:510-8. [CrossRef] [PubMed]
  7. Quan SF, Anderson JL, Hodge GK. Use of a supplementary internet based education program improves sleep literacy in college psychology students. J Clin Sleep Med. 2013 Feb 1;9(2).:155-60. [CrossRef] [PubMed]
  8. Dietrich SK, Francis-Jimenez CM, Knibbs MD, Umali IL, Truglio-Londrigan M. Effectiveness of sleep education programs to improve sleep hygiene and/or sleep quality in college students: a systematic review. JBI Database System Rev Implement Rep. 2016 Sep;14(9).:108-134. [CrossRef] [PubMed]
  9. Kohansieh M, Makaryus AN. Sleep Deficiency and Deprivation Leading to Cardiovascular Disease. Int J Hypertens. 2015;2015:615681. [CrossRef] [PubMed]
  10. Varga MD. Adderall abuse on college campuses: a comprehensive literature review. J Evid Based Soc Work. 2012;9(3).:293-313. [CrossRef] [PubMed]
  11. Poulos NS, Pasch KE. Energy drink consumption is associated with unhealthy dietary behaviours among college youth. Perspect Public Health. 2015 Nov;135(6).:316-21. [CrossRef] [PubMed]
  12. Kloss JD, Nash CO, Walsh CM, Culnan E, Horsey S, Sexton-Radek K. A "sleep 101" program for college students improves sleep hygiene knowledge and reduces maladaptive beliefs about sleep. Behav Med. 2016;42(1).:48-56. [CrossRef] [PubMed]
  13. Brown FC, Buboltz WC Jr, Soper B. Development and evaluation of the sleep treatment and education program for students (STEPS).. J Am Coll Health. 2006 Jan-Feb;54(4).:231-7. [CrossRef] [PubMed]
  14. Clark EA. Sleep quality effects of a brief intervention in college students. Proquest Dissertations Publishing. 2010; Available at: http://search.proquest.com.ezproxy1.library.arizona.edu/pqdtglobal/docview/366769369/abstract/3344BC445DD24AAEPQ/1?accountid=8360 (requires subscription).
  15. Lamberti MPK. Improving sleep in college students: An educational intervention. ProQuest Dissertations Publishing. 2012; Available at: http://search.proquest.com.ezproxy1.library.arizona.edu/dissertations/docview/1033330040/abstract/F259A351D04140D6PQ/7?accountid=8360 (requires subscription).

Cite as: Quan SF, Ziporyn PS. The impact of an online prematriculation sleep course (sleep 101) on sleep knowledge and behaviors in college freshmen: a pilot study. Southwest J Pulm Crit Care. 2017;14(4):159-63. doi: https://doi.org/10.13175/swjpcc028-17 PDF

Saturday
Sep242016

Obstructive Sleep Apnea and Quality of Life: Comparison of the SAQLI, FOSQ, and SF-36 Questionnaires

Graciela E Silva PhDa

James L Goodwin PhDb

Kimberly D Vana, DNP, RN, FNP-BC, FNP- Cc

Stuart F Quan MDb,d,e,f 

aUniversity of Arizona College of Nursing, Tucson, AZ; bArizona Respiratory Center, University of Arizona, Tucson, AZ; cCollege of Nursing & Health Innovation, Arizona State University, Phoenix, AZ; dCollege of Medicine, University of Arizona, Tucson, AZ; eDivision of Sleep Medicine, Harvard Medical School, Boston, MA. fDivision of Sleep and Circadian Disorders, Brigham and Women’s Hospital, Boston, MA

Abstract 

Introduction: The impact of sleep on quality of life (QoL) has been well documented; however, there is a great need for reliable QoL measures for persons with obstructive sleep apnea (OSA). We compared the QoL scores between the 36-Item Short Form of the Medical Outcomes Survey (SF-36), Calgary Sleep Apnea Quality of Life Index (SAQLI), and Functional Outcomes Sleep Questionnaire (FOSQ) in persons with OSA.

Methods: A total of 884 participants from the Sleep Heart Health Study second examination, who completed the SF-36, FOSQ, and SAQLI, and in-home polysomnograms, were included. The apnea hypopnea index (AHI) at 4% desaturation was categorized as no OSA (<5 /hour), mild to moderate OSA (5-30 /hour) and severe OSA (>30 /hour). QoL scores for each questionnaire were determined and compared by OSA severity category and by gender.

Results: Participants were 47.6% male, 49.2% (n=435) had no OSA, 43.2% (n=382) had mild to moderate OSA, and 7.6% (n=67) had severe OSA. Participants with severe OSA were significantly older (mean age = 63.7 years, p <.0001), had higher BMI (mean = 34.3 kg/m2, p <.0001) and had lower SF-36 Physical Component scores (PCS) (45.1) than participants with no OSA (48.5) or those with mild to moderate OSA (46.5, p= .006). When analyzed according to gender, no significant differences were found in males for QoL by OSA severity categories. However, females with severe OSA had significantly lower mean scores for the SAQLI (5.4, p= .006), FOSQ (10.9, p= .02), and SF-36 PCS (37.7, p<.0001) compared to females with no OSA (6.0, 11.5, 44.6) and those with mild to moderate OSA (5.9, 11.4, 48, respectively). Females with severe OSA also had significantly higher mean BMI (41.8 kg/m2,) than females with no OSA (26.5 kg/m2) or females with mild to moderate OSA (30.6 kg/m2, p<.0001). The SF-36 PCS and Mental Component Scores (MCS) were correlated with the FOSQ and SAQLI (r=.37 PCS vs FOSQ; r=.31 MCS vs FOSQ; r=.42 PCS vs SAQLI; r=.52 MCS vs SAQLI; and r=.66 FOSQ vs SAQLI, p<.001 for all correlations). Linear regression analyses, adjusting for potential confounders, indicated that the impact of OSA severity on QoL is largely explained by the presence of daytime sleepiness. 

Conclusion: The impact of OSA on QoL differs between genders with a larger effect on females and is largely explained by the presence of daytime sleepiness. Correlations among QoL instruments are not high and various instruments may assess different aspects of QoL.

Introduction

Obstructive sleep apnea (OSA) is a highly prevalent condition occurring in as many as 17% and 9% of middle aged males and females, respectively (1). OSA is now recognized as an important risk factor for the development of hypertension and coronary heart disease as well as premature death (2). However, patients frequently present to health care providers with symptoms that are indicative of impairment in their quality of life (QoL). Improvement in QoL is an important determinant of whether patients adhere to continuous positive airway pressure (CPAP), the most commonly prescribed treatment for OSA. Additionally, measurement of QoL is one of the quality metrics recently developed for use in clinical practice (3) thus increasing the importance of evaluating tools used to assess QoL in OSA.

A variety of tools to measure QoL have been utilized in epidemiologic studies and clinical trials of OSA. The most common general QoL instrument used has been the Medical Outcomes Study Short-Form Health Survey SF-36 (4). More recently, two sleep specific QoL questionnaires have been developed, the Functional Outcomes of Sleep Questionnaire (FOSQ) (5) and the Sleep Apnea Quality of Life Inventory (SAQLI) (6). Whether these sleep specific QoL instruments are more sensitive in those with OSA than general QoL questionnaires is not clear. Furthermore, there have been few comparisons of the FOSQ to the SAQLI with respect to their sensitivity in those with OSA and whether QoL differs between males and females. Using data from a large cohort study, the purposes of these analyses were to compare these instruments to each other, to assess whether they were able to detect differences in QoL among groups with different severities of OSA and to determine whether there were differences between genders.

Methods

The Sleep Heart Health Study (SHHS) is a prospective multicenter cohort study designed to investigate the relationship between OSA and cardiovascular diseases in the United States. Details of the study design have been published elsewhere (7). Briefly, initial baseline recruitment began in 1995, enrolling 6,441 subjects, 40 years of age and older, from several ongoing geographically distinct cardiovascular and respiratory disease cohorts who were initially assembled between 1976 and 1995 (8). These cohorts included the Offspring Cohort and the Omni Cohort of the Framingham Heart Study in Massachusetts; the Hagerstown, MD, and Minneapolis, MN, sites of the Atherosclerosis Risk in Communities Study; the Hagerstown, MD, Pittsburgh, PA, and Sacramento, CA, sites of the Cardiovascular Health Study; 3 hypertension cohorts (Clinic, Worksite, and Menopause) in New York City; the Tucson Epidemiologic Study of Airways Obstructive Diseases and the Health and Environment Study; and the Strong Heart Study of American Indians in Oklahoma, Arizona, North Dakota, and South Dakota. A SHHS follow-up examination took place between February 2000 and May 2003, enrolling 4,586 of the original participants who had a repeat polysomnogram in addition to completing questionnaires and undergoing other measurements. The present study focused on 884 participants from the Tucson and Framingham sites of the Sleep Heart Health Study second examination in whom data were available from the sleep habits questionnaire, all quality of life questionnaires, and in-home polysomnograms. Data was limited to these sites because administration of the FOSQ was not done at the other field centers. 

The SHHS was approved by the respective institutional review boards for human subjects research, and informed written consent was obtained from all subjects at the time of their enrollment into each stage of the study.

Polysomnography

Participants underwent overnight in-home polysomnograms using the Compumedics Portable PS-2 System (Abbottsville, Victoria, Australia) administered by trained technicians (9). Briefly, after a home visit was scheduled, the Sleep Health Questionnaire, SF-36, SAQLI, and FOSQ questionnaires generally were mailed 1 to 2 weeks prior to the in-home polysomnography appointment. Each participant was asked to complete the questionnaire before the home visit, at which time the questionnaires were collected and verified for completeness. The home visits were performed by two-person, mixed-sex teams in visits that lasted 1.5 to 2 hours. There was emphasis on making the night of the polysomnographic assessment as representative as possible of a usual night of sleep. Participants were asked to schedule the visit so that it would occur approximately two hours prior to their usual bedtime. Participants’ weekday or weekend bedtime routines were encouraged to be consistent with the day of the week that the visits were made.

The SHHS recording montage consisted of electroencephalogram (C4/A1 and C3/A2), right and left electrooculogram, a bipolar submental electromyogram, thoracic and abdominal excursions (inductive plethysmography bands), airflow (detected by a nasal-oral thermocouple [Protec, Woodinville, WA]), oximetry (finger pulse oximetry [Nonin, Minneapolis, MN]), electrocardiogram and heart rate (using a bipolar electrocardiogram lead), body position (using a mercury gauge sensor), and ambient light (on/off, by a light sensor secured to the recording garment). Sensors were placed, and equipment was calibrated during an evening home visit by a certified technician. After technicians retrieved the equipment, the data, stored in real time on PCMCIA cards, were downloaded to the computers of each respective clinical site, locally reviewed, and forwarded to a central reading center (Case Western Reserve University, Cleveland, OH). Comprehensive descriptions of polysomnography scoring and quality-assurance procedures have been previously published (9, 10). In brief, sleep was scored according to guidelines developed by Rechtschaffen and Kales (11, 12). Strict protocols were maintained to ensure comparability among centers and technicians. Intra-scorer and inter-scorer reliabilities were high (10). As in previous analyses of SHHS data, an apnea was defined as a complete or almost complete cessation of airflow, as measured by the amplitude of the thermocouple signal, lasting at least 10 seconds. Hypopneas were identified if the amplitude of a measure of flow or volume (detected by the thermocouple or thorax or abdominal inductance band signals) was reduced discernibly (at least 25% lower than baseline breathing) for at least 10 seconds and did not meet the criteria for apnea. For this study, only apneas or hypopneas associated with a 4% or greater oxyhemoglobin desaturation were considered in the calculation of the apnea hypopnea index (AHI, apneas plus hypopneas per hour of total sleep time).

Sleep Habits Questionnaire and Covariates

Participants completed the SHHS Sleep Habits Questionnaire (13). The Sleep Habits Questionnaire contained questions regarding sleep habits. Height and weight were measured directly to determine body mass index (BMI, kg/m2). Sex and ethnicity were derived from data obtained from the SHHS parent cohorts. Participants answered yes or no to having a healthcare provider diagnosing them as having chronic obstructive pulmonary disease (COPD), chronic bronchitis, or asthma.

Sleepiness

The level of daytime sleepiness was determined using the Epworth Sleepiness Scale (ESS), a validated 8-item questionnaire that measures subjective sleepiness (14). Subjects were asked to rate how likely they are to fall asleep in different situations. Each question was answered on a scale of 0 to 3. ESS values ranged from 0 (unlikely to fall asleep in any situation) to 24 (high chance of falling asleep in all 8 situations). Mean ESS scores between 14 and 16 have been reported for patients with OSA (14, 15). Scores of 11 or greater are considered to represent an abnormal degree of daytime sleepiness (16). Sleepiness was defined as an ESS of at least 10.

Quality of Life Measures

Medical Outcomes Study Short-Form Health Survey (SF-36). Quality of life was evaluated using the Medical Outcomes Study Short-Form Health survey (SF-36) (4). The SF-36 is a multipurpose self-administered health survey consisting of 36 questions divided into 8 individual domains: (1) physical functioning (limitations in physical activity because of health problems), (2) role physical (limitations in usual role activities because of physical health problems), (3) bodily pain, (4) general health perceptions; (5) vitality (energy and fatigue), (6) social functioning (limitation in social activities because of physical or emotional problems), (7) role emotional (limitation in usual role activities because of emotional problems), and (8) general mental health. In addition, the 8 scales are used to form 2 distinct high-order summary scales: the physical component summary (PCS) and the mental component summary (MCS) (17). The PCS includes the physical functioning, role physical, bodily pain, and general health scales, and the MCS includes the vitality, social functioning, role emotional, and general mental health scales. The raw scores for each subscale and the 2 summary measures are standardized, weighted, and scored according to specific algorithms. The scores for the multifunction item scales and the summary measures range from 0 to 100, with higher scores indicating better quality of life. For the present study, we use only the PCS and MCS scales.

Functional Outcomes Sleep Questionnaire (FOSQ). The FOSQ was developed as a self-report instrument to assess the disorders of sleepiness on quality of life. It consists of 30 items with 5 factor-based subscales: activity level, vigilance, intimacy and sexual relationships, general productivity and social outcome. A mean weighted item score is obtained for each subscale. The subscales are summed to produce a global score (5). In SHHS, questions related to sexual intimacy were omitted because there were concerns that some participants would find these embarrassing or offensive.

Sleep Apnea Quality of Life Index (SAQLI). The SAQLI was developed as a sleep apnea specific quality of life instrument (6). It is a 35 item instrument that captures the adverse impact of sleep apnea on 4 domains: daily functioning, social interactions, emotional functioning, and symptoms. Items are scored on a 7-point scale with “all of the time” and “not at all” being the most extreme responses. Item and domain scores are averaged to yield a composite total score between 1 and 7. Higher scores represent better quality of life. In SHHS, the short form of the SAQLI was administered, because it allowed for self-completion by the participants (18).

Statistical Analysis

Differences in proportions for descriptive characteristics between OSA severity categories, and categorical variables were analyzed using Chi-square tests with 2 degrees of freedom. Fisher’s exact test was used when the expected frequency was less than 5 in any cell. One-way analyses of variance (ANOVA) were used to compare differences in mean values for continuous variables (BMI, total sleep time, SAQLI, FOSQ, SF-36 MCS, and SF-36 PCS) by OSA severity categories and by these categories separately for males and females. Pearson’s correlations were used to test for correlation coefficients between the four quality of life scales, SAQLI, FOSQ, SF-36 MCS, and SF-36 PCS.

Separate multivariate linear regression models were fitted to evaluate scores from each of the four QoL scales by OSA categories for males and females. Potential confounders (age, race, COPD, chronic bronchitis, ESS and asthma) were evaluated and adjusted for in the models; only those variables with significant coefficients were kept in the models. Thus, OSA severity, ESS, and asthma were the only variables retained in the final models. All statistical tests were performed using statistical software (Stata SE, version 13.0 for Windows; Stata Corp; College Station, TX) and a significance level of 0.05.

Results

Participants were 47.6% male and 52.4% female, 49.2% (n=435) had no OSA, 43.2% (n=382) had mild to moderate OSA, and 7.6% (n=67) had severe OSA. Approximately 21% of participants with mild to moderate OSA and 39% of those with severe OSA reported excessive daytime sleepiness (ESS >10) (Table 1).

Participants with severe OSA were significantly older (mean age = 63.7 years, p <.0001), had higher BMI (mean = 34.3 kg/m2, p <.0001) and had lower SF-36 PCS scores (45.1, p= .006) than participants with no OSA or those with mild to moderate OSA. There was also a trend towards lower scores on the MCS of the SF-36, the SAQLI, and the FOSQ (Table 2).

When analyzed according to gender, no significant differences were found in males for QoL by OSA severity categories (Table 3).

Males with severe OSA had significantly higher BMI (mean 31.9, p<.0001) than males with no OSA or males with mild to moderate OSA. However, as shown in Table 4, females with severe OSA had significantly lower mean scores for the SAQLI (5.4, p= .006), FOSQ (10.9, p= .02), and SF-36 PCS (37.7, p<.0001) compared to females with no OSA and those with mild to moderate OSA.

Females with severe OSA also had significantly higher BMI (mean 41.8, p<.0001) than females with no OSA or females with mild to moderate OSA.

As shown in Table 5, comparisons between the QoL measures showed small correlations between the FOSQ and the SF-36 MCS (r=.31, p < .001) and the SF-36 PCS (r=.37, p <.001), and medium correlations between the SAQLI and the SF-36 MCS (r=0.52, p <.001) and the SF-36 PCS (r=.42, p < .001).

The correlation between the SAQLI and FOSQ was 0.66, p <.001, and the correlation between SF-36 MCS and SF-36 PCS was -.024, however this was not significant (p = .142). In addition, ESS scores were inversely correlated with the SAQLI (r = -.36), FOSQ (r = -.43), MCS (r = -.17), and PCS (r = -.16) (data not shown).

Because categorical analyses showed no difference for males in QoL scores, we, therefore, ran linear regression models separately for females and males (Table 6).


Discussion

In these analyses using a general (SF-36) and two sleep specific QoL assessment tools (FOSQ and SAQLI), we found that QoL was reduced in those with severe OSA; substantial differences were not apparent among participants with mild to moderate OSA and those with no OSA. However, there were significant gender disparities. Females with severe OSA demonstrated a substantial reduction in QoL with all instruments, but there was a lack of differences among males by OSA severity. The reductions in QoL were explained primarily by the presence of sleepiness. Furthermore, correlations among QoL questionnaires were modest at best, indicating that they assess different QoL domains.

When males and females were analyzed together in our study, only the PCS of the SF-36 showed a significant reduction in QoL in participants with OSA, but this was limited solely to participants with severe OSA. Additional studies also have found lower QoL only in those with severe OSA (19, 20). Moreover, other studies have failed to find any differences in QoL among participants with a broad spectrum of OSA severity (21-23). In one of these studies, Lee and colleagues (22) found that the AHI was not associated with differences in the PCS or MCS of the SF-36 in a large group of patients seen in a sleep clinic. In their study, other factors, such as age, gender, minimum oxygen saturation, sleepiness, and depression were associated with the PCS or MCS scores. Our study also found a strong trend between sleepiness and QoL scores for females and males. Similarly, in a smaller study, Lee et al. (22) did not find differences in the SAQLI among OSA patients of different severities. Our data also are consistent with a previous analysis from the first examination of SHHS in which severe OSA was associated with worse QoL on most subscales of the SF-36, but only the vitality subscale was reflective of poorer QoL in participants with OSA of less severity. In contrast, even mild OSA was associated with reduced QoL in comparison to no OSA among the middle-aged males and females of the Wisconsin Sleep Cohort (24). However, our cohort was older than participants in the Wisconsin Sleep Cohort and only a small sample from the SHHS was analyzed in the present study. Thus, age and other demographic differences among the cohorts may provide explanations for these discrepancies. Nevertheless, despite the absence of large cross-sectional differences in QoL as a function of OSA severity, in most studies, the SF-36, SAQLI, and FOSQ have been shown to be sensitive to changes in QoL after OSA treatment.

When analysis of our data was performed separately according to gender, we observed that the reduction in QoL with severe OSA was limited to females irrespective of the QoL instrument. Other studies (22) also have noted that QoL in participants with OSA is worse in women. However, in a study of a large cohort of males, Appleton et al.,(25) found that increasing AHI was associated with lower QoL on the SF-36, but only in those less than 69 years of age. The median age of the SHHS cohort is 60 years with substantial numbers of participants older than 70 years.  Thus, our results and those of Appleton et al. (25) may not be discrepant necessarily.

Excessive daytime sleepiness is one of the most common symptoms in OSA, and sleepiness can have a profound negative impact on QoL. Thus, not surprisingly, our multivariate analyses demonstrated that the negative impact of severe OSA was explained primarily by the presence of sleepiness. Our finding is consistent with the findings of some, (19, 22, 23, 26) but not all previous studies (27). The explanation for these inconsistent findings is not readily apparent, but possibilities include whether study populations were recruited from the general population or clinic, as well as whether the cohorts had other co-morbidities that would impact QoL. A differential perception of sleepiness between males and females offers a possible explanation of the greater impact of OSA on QoL in the latter. However, this assertion seems unlikely inasmuch as previous studies indicate females with OSA are more likely to report fatigue rather than sleepiness (28-30).

We observed that correlations among the SF-36, SAQLI, and FOSQ were relatively weak to moderate. Our results are consistent with the few studies that have done similar comparisons. In a Spanish multicenter study (21), correlations of the FOSQ and several scales of the SF-36 with the 4 domains of the SAQLI were poor to moderate. They ranged from r=.179 between the FOSQ and SAQLI Emotional Functioning domain to r=.579 for the SF-36 Vitality and SAQLI Daily Functioning domain. In a Polish study (31), the correlation between the SF-36 and the FOSQ was r=.46 and between the SF-36 and the SAQLI was r=.47. Other studies have compared the SF-36 to other general QoL instruments in patients with OSA, with some, but not all, demonstrating reasonable correspondence (32, 33).  Considering our results with other studies, various instruments may sample different aspects of QoL. Care should be exercised when selecting a tool to assess health outcomes in OSA.

There are several important limitations to our findings. First, the SHHS cohort was recruited from participants enrolled in other longitudinal studies, many of whom were long-time participants. These individuals may represent a group of survivors who would generally have better QoL regardless of OSA-severity status. Second, as a group, the SHHS cohort is older (mean age = 61.6 years) and may not be representative of the US adult population. Third, SHHS is a general population cohort, and thus, unlike a clinical cohort, some did not have symptoms of OSA. Finally, severity of OSA may not be best reflected by the AHI. Other markers of severity such as amount of oxygen desaturation or degree of sleep fragmentation may be better surrogates to show differences in QoL. Nevertheless, despite these limitations, our analyses have some unique qualities such as a well-characterized, racially and ethnically diverse cohort, use of home-based polysomnography to assess the severity of OSA, and data related to QoL derived from 3 different instruments.

In conclusion, in a middle-aged to elderly cohort, QoL is poorer only in females with severe OSA. To a large extent, these findings can be explained by the presence of daytime sleepiness. Correlations among 3 commonly used QoL instruments used in persons with OSA were weak to moderate, suggesting that each samples different aspects of QoL. Therefore, care should be exercised in selecting a QoL tool for documenting health care outcomes for research or clinical care.

Acknowledgments

The Sleep Heart Health Study (SHHS) acknowledges the Atherosclerosis Risk in Communities Study (ARIC), the Cardiovascular Health Study (CHS), the Framingham Heart Study (FHS), the Cornell/Mt. Sinai Worksite and Hypertension Studies, the Strong Heart Study (SHS), the Tucson Epidemiologic Study of Airways Obstructive Diseases (TES) and the Tucson Health and Environment Study (H&E) for allowing their cohort members to be part of the SHHS and for permitting data acquired by them to be used in the study.  SHHS is particularly grateful to the members of these cohorts who agreed to participate in SHHS as well. SHHS further recognizes all of the investigators and staff who have contributed to its success. A list of SHHS investigators, staff and their participating institutions is available on the SHHS website, http://www.jhucct.com/shhs/

The opinions expressed in the paper are those of the authors and do not necessarily reflect the views of the Indian Health Service.

This work was supported by HL U01HL53940 (University of Washington), U01HL53941 (Boston University), U01HL53938 and U01HL53938-07S (University of Arizona), U01HL53916 (University of California, Davis), U01HL53934 (University of Minnesota), U01HL53931 (New York University), U01HL53937 and U01HL64360 (Johns Hopkins University), U01HL63463 (Case Western Reserve University), and U01HL63429 (Missouri Breaks Research).

Dr. Silva was supported by NHLBI grant HL 062373-05A2. 

References

  1. Peppard PE, Young T, Barnet JH, Palta M, Hagen EW, Hla KM. Increased prevalence of sleep-disordered breathing in adults. Am J Epidemiol. 2013 May 1;177(9):1006-14. [CrossRef] [PubMed]
  2. Budhiraja R, Quan SF. Sleep-disordered breathing and cardiovascular health. Curr Opin Pulm Med. 2005 Nov;11(6):501-6. [CrossRef] [PubMed]
  3. Aurora RN, Collop NA, Jacobowitz O, Thomas SM, Quan SF, Aronsky AJ. Quality measures for the care of adult patients with obstructive sleep apnea. J Clin Sleep Med. 2015 Mar 15;11(3):357-83. [CrossRef] [PubMed]
  4. Ware JE Jr, Sherbourne CD. The MOS 36-item short-form health survey (SF-36). I. Conceptual framework and item selection. Med Care. 1992 Jun;30(6):473-83. [CrossRef] [PubMed]
  5. Weaver TE, Laizner AM, Evans LK, Maislin G, Chugh DK, Lyon K, Smith PL, Schwartz AR, Redline S, Pack AI, Dinges DF. An instrument to measure functional status outcomes for disorders of excessive sleepiness. Sleep. 1997 Oct;20(10):835-43. [PubMed]
  6. Flemons WW, Reimer MA. Development of a disease-specific health-related quality of life questionnaire for sleep apnea. Am J Respir Crit Care Med. 1998 Aug;158(2):494-503. [CrossRef] [PubMed]
  7. Quan SF, Howard BV, Iber C, Kiley JP, Nieto FJ, O'Connor GT, Rapoport DM, Redline S, Robbins J, Samet JM, Wahl PW.The Sleep Heart Health Study: design, rationale, and methods. Sleep. 1997 Dec;20(12):1077-85. [PubMed]
  8. Lind BK, Goodwin JL, Hill JG, Ali T, Redline S, Quan SF. Recruitment of healthy adults into a study of overnight sleep monitoring in the home: experience of the Sleep Heart Health Study. Sleep Breath. 2003 Mar;7(1):13-24. [CrossRef] [PubMed]
  9. Redline S, Sanders MH, Lind BK, Quan SF, Iber C, Gottlieb DJ, Bonekat WH, Rapoport DM, Smith PL, Kiley JP. Methods for obtaining and analyzing unattended polysomnography data for a multicenter study. Sleep Heart Health Research Group. Sleep. 1998 Nov 1;21(7):759-67. [PubMed]
  10. Whitney CW, Gottlieb DJ, Redline S, Norman RG, Dodge RR, Shahar E, Surovec S, Nieto FJ. Reliability of scoring respiratory disturbance indices and sleep staging. Sleep. 1998 Nov 1;21(7):749-57. [PubMed]
  11. Rechtschaffen A, Kales A. Manual of standardized techniques and scoring system for sleep stages of human subjects. Los Angeles: UCLA Brain Information Service and Brain Research Institute; 1968.
  12. Rechtschaffen A, Kales A. Manual of standardized techniques and scoring system for sleep stages of human subjects. Los Angeles: UCLA Brain Information Service and Brain Research Institute; 1968.
  13. Sleep Heart Heath Study Sleep Habits Questionnaire. Available at: https://biolincc.nhlbi.nih.gov/static/studies/shhs/SHHS_1_Forms/SHHS_1_Sleep_Habits_Questionnaire_-_MN.pdf (accessed 9/24/16).
  14. Johns MW. Reliability and factor analysis of the Epworth Sleepiness Scale. Sleep. 1992 Aug;15(4):376-81. [PubMed]
  15. Hardinge FM, Pitson DJ, Stradling JR. Use of the Epworth Sleepiness Scale to demonstrate response to treatment with nasal continuous positive airways pressure in patients with obstructive sleep apnoea. Respir Med. 1995 Oct;89(9):617-20. [CrossRef] [PubMed]
  16. Johns MW. A new method for measuring daytime sleepiness: the Epworth sleepiness scale. Sleep. 1991 Dec;14(6):540-5. [PubMed]
  17. Ware JE Jr., SF-36 Physical and Mental Health Summary Scales: a User's Manual. Boston, MA; Health Assesment Lab, New England Medical Center. 1994.
  18. Reimer MA, Flemons WW. Quality of life in sleep disorders. Sleep Med Rev. 2003 Aug;7(4):335-49. [CrossRef] [PubMed]
  19. Batool-Anwar S, Goodwin JL, Kushida CA, Walsh JA, Simon RD, Nichols DA, Quan SF. Impact of continuous positive airway pressure (CPAP) on quality of life in patients with obstructive sleep apnea (OSA). J Sleep Res. 2016 May 30. [CrossRef] [PubMed]
  20. Lopes C, Esteves AM, Bittencourt LR, Tufik S, Mello MT. Relationship between the quality of life and the severity of obstructive sleep apnea syndrome. Braz J Med Biol Res. 2008 Oct;41(10):908-13. [CrossRef] [PubMed]
  21. Catalán P, Martínez A, Herrejón A, Martínez-García MÁ, Soler-Catalu-a JJ, Román-Sánchez P, Pinel J, Blanquer R. Internal consistency and validity of the Spanish version of the quality of life questionnaire specific for obstructive sleep apnea: sleep apnea quality of life index. Arch Bronconeumol. 2012 Dec;48(12):431-42. [CrossRef] [PubMed]
  22. Lee W, Lee SA, Ryu HU, Chung YS, Kim WS. Quality of life in patients with obstructive sleep apnea: Relationship with daytime sleepiness, sleep quality, depression, and apnea severity. Chron Respir Dis. 2016 Feb;13(1):33-9. [CrossRef] [PubMed]
  23. Ye L, Liang ZA, Weaver TE. Predictors of health-related quality of life in patients with obstructive sleep apnoea. J Adv Nurs. 2008 Jul;63(1):54-63. [CrossRef] [PubMed]
  24. Finn L, Young T, Palta M, Fryback DG. Sleep-disordered breathing and self-reported general health status in the Wisconsin Sleep Cohort Study. Sleep. 1998 Nov 1;21(7):701-6. [PubMed]
  25. Appleton SL, Vakulin A, McEvoy RD, Vincent A, Martin SA, Grant JF, Taylor AW, Antic NA, Catcheside PG, Wittert GA, Adams RJ. Undiagnosed obstructive sleep apnea is independently associated with reductions in quality of life in middle-aged, but not elderly men of a population cohort. Sleep Breath. 2015 Dec;19(4):1309-16. [CrossRef] [PubMed]
  26. Siccoli MM, Pepperell JC, Kohler M, Craig SE, Davies RJ, Stradling JR. Effects of continuous positive airway pressure on quality of life in patients with moderate to severe obstructive sleep apnea: data from a randomized controlled trial. Sleep. 2008 Nov;31(11):1551-8. [PubMed]
  27. Szentkirályi A, Madarász CZ, Novák M. Sleep disorders: impact on daytime functioning and quality of life. Expert Rev Pharmacoecon Outcomes Res. 2009 Feb;9(1):49-64. [CrossRef] [PubMed]
  28. Chervin RD. Sleepiness, fatigue, tiredness, and lack of energy in obstructive sleep apnea. Chest. 2000 Aug;118(2):372-9. [CrossRef] [PubMed]
  29. Chervin RD. Epworth sleepiness scale? Sleep Med. 2003 May;4(3):175-6. [CrossRef] [PubMed]
  30. Tamanna S, Geraci SA. Major sleep disorders among women: (women's health series). South Med J. 2013 Aug;106(8):470-8. [CrossRef] [PubMed]
  31. Kasibowska-Kuลบniar K, Jankowska R, Kuลบniar T, Brzecka A, Piesiak P, Zwierzycki J. [Comparative evaluation of two health-related quality of life questionnaires in patients with sleep apnea]. [Article in Polish] Wiad Lek. 2004;57(5-6):229-32. [PubMed]
  32. Jenkinson C, Stradling J, Petersen S. Comparison of three measures of quality of life outcome in the evaluation of continuous positive airways pressure therapy for sleep apnoea. J Sleep Res. 1997 Sep;6(3):199-204. [CrossRef] [PubMed]
  33. Jenkinson C, Stradling J, Petersen S. How should we evaluate health status? A comparison of three methods in patients presenting with obstructive sleep apnoea. Qual Life Res. 1998 Feb;7(2):95-100. [CrossRef] [PubMed]

Cite as: Silva GE, Goodwin JL, Vana KD, Quan SF. Obstructive sleep apnea and quality of life: comparison of the SAQLI, FOSQ, and SF-36 questionnaires. Southwest J Pulm Crit Care. 2016;13(3):137-49. doi: http://dx.doi.org/10.13175/swjpcc082-16 PDF 

Tuesday
May192015

Gender Differences in Real-Home Sleep of Young and Older Couples

Maryam Butt, MSc1

Stuart F. Quan, MD3,4,5

Alex (Sandy) Pentland, PhD2

Inas Khayal, PhD1, 2


1Masdar Institute of Science and Technology, Abu Dhabi, UAE

2Massachusetts Institute of Technology, Cambridge, MA, USA

3Division of Sleep Medicine, Harvard Medical School, Boston, MA, USA

4Arizona Respiratory Center, University of Arizona College of Medicine, Tucson, AZ, USA

5Division of Sleep and Circadian Disorders, Brigham and Women’s Hospital, Boston, MA, USA


Abstract

Objectives: To understand gender differences in sleep quality, architecture and duration of young healthy couples in comparison to older couples in their natural sleep environment.

Design: Sleep was monitored in a naturalistic setting using a headband sleep monitoring device over a period of two weeks for young couples and home polysomnography for the older couples.

Participants: Ten heterosexual young couples (male mean age: 28.2 1.0[SD] years  /female mean age: 26.8 0.9 years) and 14 older couples (male mean age: 59.3+ 9.6 years/female mean age: 58.8+ 9.1 years).

Measurements and results: In the young couples, total sleep time (395+66 vs. 367+54 min., p<0.05), sleep efficiency (97.0+3.0 vs. 91.1+7.9, p<0.001), and % REM (31.1+4.8 vs. 23.6+5.5, p<0.001) in males was higher than in females. In contrast, % light sleep (51.7+7.1 vs. 59.7+6.7, p<0.001) and number of arousals (2.9+1.9 vs. 5.3+1.9, p<0.001) were lower.  These differences persisted after controlling for evening mood and various evening pre-sleep activities. In the older couples, there were no differences between genders. In addition, children in the household adversely impacted sleep.

Conclusions: In couples recorded in the home, young males slept longer and had better sleep quality than young females. This difference appears to dissipate with age. In-home assessment of couples can aid in understanding of gender differences in sleep and how they are affected by age and social environment.

Introduction

Sleep has a considerable public health impact and is needed to maintain optimal health and well-being. Impaired sleep has been shown to have adverse health effects from psychiatric illnesses such as depression (1) to physical health risks such as obesity and diabetes (2-4). Poor sleep has also been shown to lead to behavioral consequences such as sleepiness, impaired cognitive function, low job performance and motor vehicle accidents resulting in both health and financial losses (5). However, the prevalence of sleep disturbances varies according to both age and gender (6). In addition, objective assessments of sleep find that sleep architecture changes as a function of both these factors (7). This was confirmed in a study by Redline et al in which interactions between age and gender were an important factor in explaining variations in sleep architecture (8).

Studies investigating gender differences in sleep have mostly relied on laboratory polysomnography (PSG), wrist actigraphy and subjective survey instruments (9-11). These studies have not been able to capture sleep quality, architecture and duration from the subject’s natural sleep environment, which may be surrounded and affected by their bed partner, children or their routine sleep schedule. Furthermore, in many of these studies, the age spectrum of the participants was limited (9,12). With the recent availability of home sleep monitoring devices, it is now possible to objectively measure detailed sleep parameters in subjects’ real-home environment. This methodology attempts to minimize any disruptions to an individual’s naturalistic sleep setting.

The purpose of this study was to utilize a portable sleep monitoring device to measure detailed sleep parameters of young healthy couples in their real-home environment to study gender differences. In addition, we compared these results to home sleep recordings obtained from older adults to assess whether there were changes with age. We hypothesize that sleep parameters measured in a naturalistic setting will be affected by gender given the different social roles of young married men and women. In addition, we posited that these changes would evolve with age.

Methods

Study Populations

Graduate Student Cohort. This cohort consisted of 10 young healthy married heterosexual couples. The participants were residents of a vibrant married graduate-student community about half of whom had children. The mean age of male subjects was 28.2 years (SD 1.0) and the mean age for females was 26.8 years (SD 0.9). Fourteen of the 20 subjects were M.S. and Ph.D. students (10 males and 4 females). The remaining subjects were spouses that were not students. Four couples had children while the remaining did not. Flyers and e-mail messages were used to recruit participants. We recruited couples in which both members were willing to participate. The inclusion criteria also required the couples to share the sleep environment. Participants did not receive any financial compensation for their participation in this experiment. Data were collected over a period of two weeks in March and April 2011 in a naturalistic setting while participants underwent their normal routine activities.

Older Couples Cohort. This cohort was comprised of 14 married couples randomly selected from participants in the Sleep Heart Health Study (SHHS) none of whom were found to have obstructive sleep apnea (Apnea Hypopnea Index < 5 events/hour). The mean age of male participants was 59.3 years (SD + 9.6) and the mean age for females was 58.8 years (SD + 9.1). Overall recruitment in the SHHS has been previously reported (13,14). Briefly SHHS participants were recruited from several ongoing longitudinal cohort studies of cardiovascular or pulmonary disease. In addition to information obtained by their parent studies, they were asked to undergo an ambulatory polysomnogram and collection of data relevant to sleep. We used data from the first examination of SHHS (1995-1997) for this analysis.

Polysomnogram Data Collection

For the Graduate Student Cohort, detailed sleep parameters were recorded using an automated wireless system (ZEO Inc., Newton, MA) which includes an elastic head-band and a bed-side unit. It has been validated and found to be reliable and accurate for monitoring sleep in healthy adults (15,16). Sensors embedded on the headband detect single-channel frontal EEG (electroencephalographic) signals. The headband wirelessly transmits these signals to the bedside unit where the signals are then classified into the various sleep stages by an automated algorithm. The raw EEG data are not stored by the device. The bedside unit stores the sleep stage architecture (hypnogram) data onto the SD card located in the unit. The processed data can then be exported for analysis. The headband, unlike PSG electrodes, can be worn around the forehead without the use of any adhesive that makes it very simple and comfortable to use.

Each husband and wife couple were provided with the sleep monitoring device and were asked to use it for a minimum of 14 nights in their homes. The measured sleep parameters included: total sleep time (TST), rapid eye movement (Stage R, REM), time in non-slow wave NREM (Stages N1+N2, “Light Sleep”), and slow wave NREM (Stage N3, “Deep Sleep”) sleep, latency to first onset of sleep and number of awakenings. Sleep efficiency was calculated as the TST/(TST+Total Wake Time).

For the SHHS participants, as previously described, PSG was performed in an unattended setting at home (Compumedics PS-2 system; Compumedics Pty. Ltd, Abbotsville, Australia). The following channels were recorded: electroencephalogram (C3/A1 and C4/A2), right and left electrooculograms, submental electromyogram, nasal/oral airflow recorded by thermocouple (Protech, Woodenville, WA), rib cage and abdominal movement recorded by inductive plethysmography, oxyhemoglobin saturation (SpO2) by pulse oximetry (Nonin, Minneapolis, MN), and electrocardiogram. Leg movements were not recorded. Standardized techniques for sensor attachment and quality assurance were used and have been previously published (17).

Survey

Participants were asked to complete a questionnaire each morning about activities performed in the two hours prior to sleeping along with their happiness and stress levels before sleeping. Mood was measured on a scale of 1-7 (i.e., Happiness, 1: very unhappy 4: neither unhappy nor happy 7: very happy). Activities prior to sleeping included mental work (e.g., office work or studying for an exam), physical work (e.g., washing dishes, putting children to bed), heated arguments, etc. Food and beverage intake included caffeine and alcohol consumption. Activities prior to sleeping, and food and beverage consumption were measured on a scale of 1-5 (e.g., Physical activities 1: none at all 5: all the time, and caffeine intake 1: none at all, 5: a large amount). Subjects were also asked to report any cause of their sleep disturbances. Three options were provided which included disturbances by their spouse, children and other reasons. These were measured on a scale of 1-3, where 1: none at all, 3: a lot.

Data Analysis

For the Graduate Student Cohort, the few nights when subjects reported the headband falling off were eliminated from all analyses. Some participants provided recordings of less than 14 nights while others used the device for longer durations (up to 19 nights) giving a total of 281 recording nights for the sleep analysis. The mean number of nights per participant was 14 nights (SD:  0.82). In this cohort, the sleep of males was compared to females using mixed-effects linear regression models. The outcome variables were the parameters of sleep architecture and gender represented the sole fixed independent variable. Individual recordings for each participant were fitted as random effects to account for serial intraparticipant correlations. In preliminary analyses, the impact of repetitive recording nights was tested, and was not found to have any effect on the findings.

Multiple regression analysis also was performed in the Graduate Student Cohort to understand how pre-sleep mood and activities affected sleep parameters. The independent variables included the pre-sleep activities and mood variables that showed significant gender differences on univariate testing by analysis of variance. Activities and mood were coded as dummy variables (0: no activity and 1: when the activity was performed). Gender (0: Female, 1: Male) and children (0: without children, 1: with children) were also added as covariates. There were a total of 206 nights with both survey and sleep information. The analyses were performed for the following sleep parameters: Total Sleep Time, Wake Time, Sleep Latency, Sleep Efficiency, % Light Sleep %, Deep Sleep % and REM % as the dependent variables. The standardized coefficient β is reported as a measure of strength of the relationship. We considered p values less than or equal to 0.01 as indicating statistical significance.

For the SHHS cohort, there was only a single night of recording. Comparisons between males and females were performed using a one way analysis of variance with sleep architecture parameters as the dependent variables and gender as the independent variable.

In order to compare the two cohorts, the aggregated mean for each sleep architecture parameter was calculated for the Graduate Student Cohort. In the SHHS cohort, N1 and N2 sleep were combined as “Light Sleep” and N3 sleep was considered equivalent to “Deep Sleep” to provide comparability to the Graduate Student Cohort. Within each gender, differences in sleep parameters were contrasted using a one way analysis of variance.

Data are presented as mean + SD or as regression coefficients (β). In the case of the Graduate Student Cohort, the data represent the mean of all recording nights.

Results

In Table 1 is shown the sleep architecture for both cohorts stratified by gender.

Table 1. Sleep Architecture in Young and Older Couples

ap<0.05          Male vs. Female

bp<0.001        Male vs. Female

cp<0.001        Graduate Student Males vs. Older Males

dp<0.05          Graduate Student Males vs. Older Males

ep<.01            Graduate Student Males vs. Older Males

fp<.05             Graduate Student Females vs. Older Females

In the Graduate Student Cohort, total sleep time, sleep efficiency and %REM sleep were higher in males than females (Table 1 and Figure 1).

Figure 1. Panel A: Total sleep time in minutes. Panel B: Sleep efficiency (5). *p<0.05 graduate student males compared to females. +p<0.001 graduate student males compared to females. #p<0.001 graduate student males compared to older males.

Light sleep and arousals were lower. In sensitivity analyses, we restricted the dataset only to nights where both couples wore the recording device and also only to nights where no caffeine was consumed. Our findings were substantially the same in either case. In contrast, there were no significant differences between males and females in the SHHS cohort. When the sleep of the Graduate Student Cohort was compared to the SHHS cohort, differences were generally confined to males. Males in the SHHS cohort had lower sleep efficiency, % REM and % Deep Sleep, and higher amounts of arousals and % Light Sleep. The only difference observed in female comparisons was the higher number of arousals in the SHHS cohort.

Table 2 illustrates the impact of children in the households of the Graduate Student Cohort. In those without children sleep efficiency was slightly better and the number of arousals was marginally less.

Table 2. Impact of Children on Sleep Architecture in Graduate Student Couple 

a p<0.01         Without children vs. with children

b p=0.088       Without children vs. with children

Males and females were also found to differ in their mood and activities prior sleeping. Females reported being happier prior sleeping than males (5.13+1.17 vs. 4.55+1.15, p<0.001). There were trends for males to be more involved with mental work (2.65+1.62 vs. 2.03+1.47, p=0.02) and to consume more caffeine (1.36+0.76 vs. 1.17+0.61, p<0.03) prior sleeping. In contrast, females did more physical work (1.23+0.55 vs. 1.92+1.15, p<0.001) and tended to eat more food (1.83+1.01 vs. 1.57+0.80, p=0.023).

The impact of evening activities on nighttime sleep is presented in Table 3. As shown by the model’s negative β coefficient, total sleep time was adversely impacted by female gender and mental work. In contrast, wake time was increased by gender, food intake and possibly physical work, but decreased by mood (happiness). The remaining sleep variables except for % Deep Sleep also were impacted by gender. In addition, as shown in Table 3, sleep latency, sleep efficiency, % Light Sleep, % Deep Sleep and % REM were variously affected by evening activities.

Table 3. Impact of Evening Pre-sleep Activities, Mood and Gender on Sleep in Graduate Students (n=206)

a Variables analyzed in each model with their respective β and p values are shown vertically underneath each dependent sleep variable.

b The overall R2 for each model

Discussion        

In this study of couples sleeping together, we found that the naturalistic sleep of young males was better than females, but that these differences were not apparent in the sleep of older adults. Comparison of these groups indicated that the changes were a result of a decline in sleep quality in males. Including assessments of mood and pre-sleep activities in analyses did not substantially affect observed differences in sleep between genders in the younger couples. We also noted that children in the household had a negative effect on sleep quality. 

We observed that total sleep time, sleep efficiency and %REM sleep were higher in young males than young females. This finding is consistent with most previous studies observing that symptoms of sleep disturbances are less common in males (6,18-22). In contrast, previous polysomnographic recordings generally show better sleep quality among females (7,8,10,23-27), but many of these studies were conducted using only older populations (8,23,25,26). Nevertheless, in the few polysomnographic studies performed that have included younger individuals, there have been discordant results with no differences observed between genders (7) or females exhibiting better sleep (24, 27). However, only one of these was performed in a home environment and also analyzed the impact of bedpartners (27). In that study, sleep latency was longer in those sleeping with a bedpartner, but may have been confounded by age because older subjects were more likely to sleep by themselves (27). Although females in today’s society are more likely to have careers outside the home, they nonetheless still may shoulder a greater burden of the household chores as we found in our study. This may translate into a shorter duration of sleep and poorer sleep quality, and may represent the difference in social roles of married women relative to their partners. However, this is likely not the entire explanation because differences in total sleep time and sleep architecture persisted even after controlling for pre-sleep evening activities.

One explanation for our novel finding of better sleep in young males living with a bedpartner is our assessment of sleep in a naturalistic environment. Most previous studies that have recorded sleep have utilized laboratory PSG (7,8,10,23-27). Although it is considered the “gold standard” for objectively assessing sleep, the unfamiliar environment of a laboratory can disturb and change an individual’s usual sleep quality and quantity from that under habitual conditions (28-30). Laboratory PSG does not allow subjects to sleep in their naturalistic environment and follow their usual bedtime rituals. Hence, these studies are unable to capture the contribution of their routine behaviors on their sleep and may not be reflective of the subject’s home sleep. In-home studies have utilized methods such as actigraphy. However, it only indirectly detects sleep/wake patterns and is prone to inaccuracies by misinterpreting quiet wakefulness as sleep (31, 32). Furthermore, actigraphy cannot evaluate the different stages of sleep precluding studies to understand gender differences in these. Although survey collected information can assess sleep in a real-life environment, data can be incomplete, inaccurate and subject to recall bias (33). Our study overcomes the aforementioned limitations of PSG, actigraphy and surveys by capturing detailed sleep parameters in a real-home environment using a validated portable relatively unobtrusive sleep monitoring device and may be a model for future naturalistic sleep research.

The difference in sleep between genders we observed in our younger couples did not persist in the older couples. This appears to be related to disproportionate deterioration in sleep quantity and quality in males. Previous cross-sectional analyses of sleep in older persons have also found that sleep in males appears to be worse than in females (7,8,23,27). These previous observations in combination with our findings indicate as suggested by others (23), that over the lifespan, the sleep of males changes at a more rapid rate than in females.

Another interesting, but perhaps not surprising result was that couples without children had more and less interrupted sleep than those without children. Although parenthood is an important life event, very few studies have looked at sleep quality and architecture differences in people with and without children. An epidemiological study of sleep duration in United States found that parents with young children were more likely to get less sleep than those without children (34). Furthermore, the presence of children affects parents’ bedtimes and risetimes (35). However, these studies are based on self-reported data. Our results suggest that these differences should be further explored to understand how demographic and social factors impact our sleep quality and architecture.

One of the limitations of this study is its small sample size. Further larger studies should be performed to validate these results. Second, sleep staging by the sleep monitoring device is less accurate for distinguishing between wake and sleep in comparison to scoring by a sleep expert (16). However, scoring of other stages is more accurate. Third, although the heterogeneity of subjects in terms of profession and demographic factors, such as children allows comparison within the different groups, it prevents us from making strong conclusion of any one group due to limitations of the sample size. Further studies with similar sample size should try to maximize the homogeneity of the subjects. Finally, our comparison analysis should be interpreted cautiously. The cohorts were recruited separately and sleep was recorded using different instrumentation and under different protocols.

In conclusion, this study utilized a novel in-home sleep monitoring device to capture the sleep quality, architecture and duration of young couples from their natural sleep environment. The results suggest that young males have better sleep quality than females. Additionally, comparison of young couples sleep to older couples suggests that differences between genders evolve over time. Future studies including larger populations should perform in-home assessment of sleep parameters of couples of all ages to understand the effect of gender on these in a naturalistic setting.

Acknowledgements

This work has been presented at the 27th Annual Meeting of the Associated Professional Sleep Societies (APSS) in Baltimore, MD, June 2013. It was partially sponsored by Masdar Institute Fellowship, MIT/Masdar Collaborative Research Grant and MIT Media Lab Consortium as well as by HL53938 from the National Heart, Lung and Blood Institute. Dr. Quan is supported by AG009975 from the National Institute of Aging.

References

  1. Al-Abri MA. Sleep Deprivation and Depression: A bi-directional association. Sultan Qaboos Univ Med J. 2015;15(1):e4-6. [PubMed]
  2. Knutson KL, Van Cauter E. Associations between sleep loss and increased risk of obesity and diabetes. Ann N Y Acad Sci. 2008;1129:287-304. [CrossRef] [PubMed]
  3. Van Cauter E, Knutson KL. Sleep and the epidemic of obesity in children and adults. Eur J Endocrinol. 2008;159 Suppl 1S59-66. [CrossRef] [PubMed]
  4. Cappuccio FP, D'Elia L, Strazzullo P, Miller MA. Quantity and quality of sleep and incidence of type 2 diabetes: a systematic review and meta-analysis. Diabetes Care. 2010;33(2):414-20. [CrossRef] [PubMed]
  5. Committee on Sleep Medicine and Research Board on Health Sciences Policy. Sleep disorders and Sleep Deprivation--An Unmet Public Health Problem. Washington, D.C.: National Academies Press, 2006; 404.
  6. Klink M, Quan SF. Prevalence of reported sleep disturbances in a general adult population and their relationship to obstructive airways diseases. Chest. 1987;91(4):540-6. [CrossRef] [PubMed]
  7. Williams RL, Karacan I, Hursch CJ. Electroencephalography (EEG) of Human Sleep: Clinical Applications. New York: John Wiley & Sons, 1974; 169.
  8. Redline S, Kirchner HL, Quan SF, Gottlieb DJ, Kapur V, Newman A. The effects of age, sex, ethnicity, and sleep-disordered breathing on sleep architecture. Arch Intern Med. 2004;164(4):406-18. [CrossRef] [PubMed]
  9. van den Berg JF, Miedema HM, Tulen JH, Hofman A, Neven AK, Tiemeier H. Sex differences in subjective and actigraphic sleep measures: a population-based study of elderly persons. Sleep. 2009;32(10):1367-75. [PubMed]
  10. Bixler EO, Papaliaga MN, Vgontzas AN, et al. Women sleep objectively better than men and the sleep of young women is more resilient to external stressors: effects of age and menopause. J Sleep Res. 2009;18(2):221-8. [CrossRef] [PubMed]
  11. Ursin R, Bjorvatn B, Holsten F. Sleep duration, subjective sleep need, and sleep habits of 40- to 45-year-olds in the Hordaland Health Study. Sleep. 2005;28(10):1260-9. [CrossRef]
  12. Goel N, Kim H, Lao RP. Gender differences in polysomnographic sleep in young healthy sleepers. Chronobiol Int. 2005;22(5):905-15. [CrossRef] [PubMed] 
  13. Quan SF, Howard BV, Iber C, et al. The Sleep Heart Health Study: design, rationale, and methods. Sleep. 1997;20(12):1077-85. [PubMed]
  14. Lind BK, Goodwin JL, Hill JG, Ali T, Redline S, Quan SF. Recruitment of healthy adults into a study of overnight sleep monitoring in the home: experience of the Sleep Heart Health Study. Sleep Breath. 2003;7(1):13-24. [CrossRef] [PubMed]
  15. Shambroom JR, Fabregas SE, Johnstone J. Validation of an automated wireless system to monitor sleep in healthy adults. J Sleep Res. 2012;21(2):221-30. [CrossRef] [PubMed]
  16. Griessenberger H, Heib DP, Kunz AB, Hoedlmoser K, Schabus M. Assessment of a wireless headband for automatic sleep scoring. Sleep Breath. 2013;17(2):747-52. [CrossRef] [PubMed]
  17. Redline S, Sanders MH, Lind BK, et al. Methods for obtaining and analyzing unattended polysomnography data for a multicenter study. Sleep Heart Health Research Group. Sleep. 1998;21(7):759-67. [PubMed]
  18. Singareddy R, Vgontzas AN, Fernandez-Mendoza J, et al. Risk factors for incident chronic insomnia: a general population prospective study. Sleep Med. 2012;13(4):346-53. [CrossRef] [PubMed]
  19. Bixler EO, Vgontzas AN, Lin HM, Vela-Bueno A, Kales A. Insomnia in central Pennsylvania. J Psychosom Res. 2002;53(1):589-92. [CrossRef] [PubMed]
  20. Spira AP, Kaufmann CN, Kasper JD, et al. Association between insomnia symptoms and functional status in U.S. older adults. J Gerontol B Psychol Sci Soc Sci. 2014;69 Suppl 1:S35-41. [CrossRef] [PubMed]
  21. Walsh JK. Clinical and socioeconomic correlates of insomnia. J Clin Psychiatry . 2004;65 Suppl 813-19. [PubMed]
  22. Ohayon MM. Epidemiology of insomnia: what we know and what we still need to learn. Sleep Med Rev. 2002;6(2):97-111. [CrossRef] [PubMed]
  23. Walsleben JA, Kapur VK, Newman AB, et al. Sleep and reported daytime sleepiness in normal subjects: the Sleep Heart Health Study. Sleep. 2004;27(2):293-8. [PubMed]
  24. Bixler EO, Kales A, Jacoby JA, Soldatos CR, Vela-Bueno A. Nocturnal sleep and wakefulness: effects of age and sex in normal sleepers. Int J Neurosci. 1984;23(1):33-42. [CrossRef] [PubMed]
  25. Hoch CC, Dew MA, Reynolds CF,3rd, et al. A longitudinal study of laboratory- and diary-based sleep measures in healthy "old old" and "young old" volunteers. Sleep. 1994;17(6):489-96. [PubMed]
  26. Kobayashi R, Kohsaka M, Fukuda N, Honma H, Sakakibara S, Koyama T. Gender differences in the sleep of middle-aged individuals. Psychiatry Clin Neurosci. 1998;52(2):186-7. [CrossRef] [PubMed]
  27. Hume KI, Van F, Watson A. A field study of age and gender differences in habitual adult sleep. J Sleep Res. 1998;7(2):85-94. [CrossRef] [PubMed]
  28. Toussaint M, Luthringer R, Schaltenbrand N, et al. Changes in EEG power density during sleep laboratory adaptation. Sleep. 1997;20(12):1201-7. [PubMed]
  29. Hirscher V, Unbehaun T, Feige B, Nissen C, Riemann D, Spiegelhalder K. Patients with primary insomnia in the sleep laboratory: do they present with typical nights of sleep? J Sleep Res. 2015; Feb 9. [Epub ahead of print] [CrossRef] [PubMed]
  30. Moser D, Kloesch G, Fischmeister FP, Bauer H, Zeitlhofer J. Cyclic alternating pattern and sleep quality in healthy subjects--is there a first-night effect on different approaches of sleep quality? Biol Psychol. 2010;83(1):20-26. [CrossRef] [PubMed]
  31. Pollak CP, Tryon WW, Nagaraja H, Dzwonczyk R. How accurately does wrist actigraphy identify the states of sleep and wakefulness? Sleep. 2001;24(8):957-65. [PubMed]
  32. Kushida CA, Chang A, Gadkary C, Guilleminault C, Carrillo O, Dement WC. Comparison of actigraphic, polysomnographic, and subjective assessment of sleep parameters in sleep-disordered patients. Sleep Med. 2001;2(5):389-96. [CrossRef] [PubMed]
  33. Newell SA, Girgis A, Sanson-Fisher RW, Savolainen NJ. The accuracy of self-reported health behaviors and risk factors relating to cancer and cardiovascular disease in the general population: a critical review. Am J Prev Med. 1999;17(3):211-29. [CrossRef] [PubMed]
  34. Krueger PM, Friedman EM. Sleep duration in the United States: a cross-sectional population-based study. Am J Epidemiol. 2009;169(9):1052-63. [CrossRef] [PubMed]
  35. Leonhard C, Randler C. In sync with the family: children and partners influence the sleep-wake circadian rhythm and social habits of women. Chronobiol Int. 2009;26(3):510-25. [CrossRef] [PubMed]

Reference as: Butt M, Quan SF, Pentland A, Khayal I. Gender differences in real-home sleep of young and older couples. Southwest J Pulm Crit Care. 2015;10(5):289-99. doi: http://dx.doi.org/10.13175/swjpcc068-15 PDF

Tuesday
Mar102015

Brief Review: Sleep Health and Safety for Transportation Workers

Stuart F. Quan, M.D.

Laura K. Barger, Ph.D.


Division of Sleep Medicine, Harvard Medical School, Division of Sleep and Circadian Disorders

Brigham and Women’s Hospital

Boston, MA


Abstract

Accidents related to sleepiness related fatigue are an important concern in transportation related industries. This brief review outlines the public safety concerns with sleepiness related fatigue in the railroad, aviation and motor vehicle transportation fields. In addition, the common causes of sleepiness related fatigue, and impact on operators and their families are highlighted. It is suggested that in addition to greater recognition and changes in duty hour regulations, there should be a greater emphasis on the education of operators on the importance of sleep and circadian factors in causing fatigue, as well as strategies to mitigate their impact.

Reports from the Field

The following are two of many potential examples from the National Transportation Safety Board that highlight “The Problem”.

Press Release: November 19, 2002

NTSB CITES CREW SLEEP APNEA IN 2001 MICHIGAN RAIL ACCIDENT (excerpt)

On November 15, 2001 Canadian National/Illinois Central Railway southbound train 533 and northbound train 243 collided near Clarkston, Michigan. The collision occurred at a switch at the south end of a siding designated as the Andersonville siding. Train 533 was traveling at 13 miles per hour when it struck train 243. The signal at the turnout for the siding displayed a stop indication, but train 533 did not stop before proceeding onto the mainline track. Train 243 was traveling about 25 miles per hour on a "proceed" signal on the single main track when the accident occurred. Both crewmembers on train 243 were fatally injured. The two crewmen on train 533 sustained serious injuries.

The Board found that both the conductor and the engineer of train 533 suffered from obstructive sleep apnea. Although the engineer was taking prescription medication for high blood pressure and diabetes and had been instructed by his private physician to seek further medical treatment for sleep apnea, his condition was not being treated at the time of the accident. The conductor's treatment was insufficient to successfully mitigate the affects of the condition, the Board found (1).

USA Today and National Transportation and Safety Board (AAR1402): September 9, 2014

NTSB: Fatigue a factor in fatal UPS crash

At approximately 4:47 am local time on August 14, 2013, UPS Flight 1354 crashed on approach to runway 18 at Birmingham-Shuttlesworth International Airport. The fuselage broke apart killing both the pilot and co-pilot. The accident was investigated by the National Transportation Safety Board and determined that the pilots failed to monitor their altitude and had descended below the minimum altitude resulting in the plane crashing into the ground below. The Board cited several procedural violations as factors causing the crash, but contributing to the accident were “the captain's performance deficiencies likely due to factors including, but not limited to, fatigue, …” and “the first officer's fatigue due to acute sleep loss resulting from her ineffective off-duty time management and circadian factors” (2,3). On the cockpit voice recorder, the pilots are heard to be complaining of being tired.

The Problem

Two fatal transportation industry accidents. One common root cause—sleepiness induced fatigue.

Although it is difficult to estimate the exact number of public transportation accidents that have fatigue as a causal or contributing factor, there is no doubt that operator fatigue is a critical issue. For rail accidents, this statement is supported by analyses from the Collision Avoidance Working Group determining that in 19 of 65 human factors-caused mainline track train collisions, 29.3% involved impaired alertness (4).Furthermore, in testimony before the Senate Subcommittee on Surface Transportation in 1998, the Administrator of the Federal Railroad Administration stated, “human factors account for about one-third of the rail equipment accidents/incidents as well as many personal injuries”. She went on to testify that fatigue was an important underlying factor in many of them (5).

Similar concerns were voiced by the Vice Chairman of the NTSB at an aviation fatigue symposium in 2008. In that address, he stated that there had been over 250 commercial aviation fatalities the 15 years prior to his speech as well as numerous general aviation fatalities (6). Since that time, pilot and/or crew fatigue has been cited by the NTSB as a contributing cause of several commercial airline crashes including that of the well publicized Colgan Air Flight 3407 over Buffalo, New York in 2009 (7).

Fatigue related accidents also are widespread in other transportation sectors. The deadly crash of a bus carrying 32 passengers returning from a casino in Connecticut in which the NTSB found that the driver was speeding and was “impaired by fatigue at the time of the accident due to sleep deprivation, poor sleep quality and circadian factors” has been widely publicized” (8). In another event that received national attention, police alleged that the truck driver who critically injured comedian Tracy Morgan and killed another passenger had been awake for more than 24 hours at the time of the crash (9). In Newton, MA, a subway train crashed because the operator failed to brake and was killed. She had untreated sleep apnea (10).

What We Know About the Problem

Why do transportation workers experience increased rates of fatigue? For some transportation industries, work hour regulations allow for prolonged and irregular schedules and schedules that  create circadian misalignment. According to The Rail Safety Improvement Act of 2008, railroad personnel may work no longer than 12 continuous hours and all shifts must be followed by a minimum of 10 hours off for undisturbed rest. In addition, they cannot exceed 276 hours of duty in one month and after 6 consecutive days of service they must be given a minimum of 48 hours off duty at their home terminal (11). Consequently, as an extreme example, an engineer could be assigned to work a schedule of 12 hours on and 10 hours off for 6 consecutive days. Although this is a significant improvement in comparison to work hours rules specified in previous regulations (no longer than 12 continuous hours followed by a minimum of 10 hours off duty, and that they be given at least 8 consecutive hours off duty in every 24-hour period), they nonetheless still allow very irregular working hours, unpredictability of scheduling and promote circadian misalignment. In comparison, a commercial airline pilot’s flight time is limited to 100 hours per month. However, depending on the number of flight segments and start time, their maximum duty period may be as long as 14 hours (12). Recently, new regulations incorporate variability in duty hours and rest periods to account for the impact of circadian factors on fatigue and sleepiness. Although the FAA encourages cargo airlines to voluntarily follow the new 2014 rule for flight, duty and rest requirements, it does not apply to cargo pilots, many of whom fly exclusively at night (13). A bus driver cannot drive more than 10 hours and not after having been on duty for 15 hours. Resumption of driving can only occur after 8 consecutive hours off duty. Furthermore, no driving is permitted after accumulating 60 hours on duty in 7 consecutive days (14). Truck drivers are limited to an 11 hour driving limit after 10 consecutive hours off duty, and cannot drive after the 14th consecutive hour on duty (14). Even these regulations for transportation workers allow for extended periods of continuous duty, much longer than that the traditional 8-hour work day. Furthermore, although all of these regulations specify rest periods, it is unclear whether operators actually obtain sufficient amounts of sleep.

In a survey of long haul (i.e., single long flight) and short haul (i.e., multiple flight segments per duty period) pilots, sleep deprivation was cited as a significant cause of fatigue and reduction in performance (15). In another study, the amount of sleep obtained by captains and first officers in the 24 hours prior to flight duty ranged from 3 to 13 hours with a mean of approximately 7 hours indicating that a significant proportion obtained insufficient sleep (16). Several studies have demonstrated that under current regulations, rail personnel also obtain inadequate amounts of sleep. In one study analyzing work/rest diary surveys of 200 locomotive engineers, although the average engineer obtained only slightly less sleep than a non railroader, those who started work late at night or in the very early morning slept only about five hours (17). In another study using simulated work schedules allowed by the current hours of service rules, subjects accumulated progressive sleep debt over time (18). Several older studies have documented that long haul truck drivers sleep inadequate amounts as well, with one study documenting less than 5 hours per 24 hour period (19-21). After implementation of new duty hour rules, there was some increase in the amount of sleep obtained, but it still averaged only approximately 6 hours per 24 hour period (22).

Apart from work hour rules, there are many other factors that contribute to sleep deficiency in the transportation sector. Often transportation workers are required to sleep away from home; accommodations might be in a hotel room or in the cab of a truck. Even sleeping at home may be challenging if that sleep occurs during daytime hours when noise, light and family obligations make it difficult. Additionally, the allotted rest time between shifts might be insufficient to accommodate long commutes and other tasks of daily living as well as sleep.

The health impact of sleepiness induced fatigue extends well beyond the obvious increase in human factors accidents. Accumulating data now implicate inadequate or short sleep duration as a risk factor for cardiovascular disease, hypertension, diabetes and obesity (23-25). Moreover, shift work is now considered by the World Health Organization as a probable risk factor for cancer (26). Thus, given their higher probability of experiencing chronically insufficient sleep, it is likely that transportation workers are at greater risk for these adverse health consequences of inadequate or short sleep duration than members of the general non-shift-working population.

There is also a link between insufficient sleep and behavioral health problems. Sleep deprivation is associated with acute worsening of mood, with complaints of irritability, depression, and decreased motivation (27-29). In the setting of a pre-existing mental illness, sleep deprivation may trigger a change in condition (30). There is no reason to suspect that transportation workers would be less susceptible to the behavioral consequences of sleep deprivation. Insufficient sleep is also known to adversely affect judgment (31). This can lead the person who has had insufficient sleep to underestimate its effect on his/her performance.

Fatigue is not the only issue adversely impacting the performance of transportation workers. Long hours and irregular schedules leading to chronic sleep deprivation can impact their personal lives which in turn can result in performance degradation. For example, the impact of fatigue on the family lives of train operators was extensively explored in study by Holland in 2004 (32). He found three general themes:

  1. Emotional issues impacting the family such as mood swings and irritability, and the need to compensate in some way for these;
  2. The need for family support and awareness;
  3. Social implications of the erratic schedules leading to isolation and frustration because of the inability to have a normal social life.

The importance of social well-being (leisure time and marital relationships) was further emphasized in another study of 276 railroad engineers and conductors at a North American railroad. In this study, the investigators found that social-well being was a significant mediating factor in the causal pathway between organizational factors (i.e., scheduling) and fatigue (33). Such findings are not unique to railroad workers. In a study of airline pilots, mental health was associated with fatigue and lack of family social support (34). In a study of truck drivers, almost half of the drivers felt that their work interfered with their family responsibilities and those who drove more endorsed more issues with their family life (35).

Further exacerbating the impacts of chronic sleep deprivation and shift work is the specter of primary sleep disorders themselves. Obstructive sleep apnea syndrome is conservatively estimated to have a prevalence of 2 to 4% in middle-aged women and men respectively, but rates of polysomnographically defined obstructive sleep apnea may be as high as 9 and 24% in women and men from this same study (36). A more recent study conducted in Australia found the prevalence of OSA in middle-aged men to be 53% (37). It is generally accepted that obstructive sleep apnea is underdiagnosed and most afflicted individuals are either undiagnosed or inadequately treated (38). If one excludes the pervasiveness of chronic sleep deprivation, insomnia is one of the most common sleep disorders with a point prevalence rate of approximately 30% (39). Chronic insomnia is present in 10% of the general population, and tends to be an unremitting condition (40,41). Common complaints associated with insomnia are fatigue and sleepiness. Shift work as experienced by transportation workers is a cause of insomnia. Other sleep disorders such as restless legs syndrome, periodic limb movement disorder and narcolepsy also express themselves as causes of fatigue and/or sleepiness.

In general, workers in most transportation industries are hesitant to seek medical evaluation and treatment for sleep problems. Perceived or real concern about loss of employment tends to discourage those afflicted from seeking medical care. This results in large numbers of persons with untreated conditions working in potentially dangerous environments. For example, it is estimated that using a moderately conservative definition of obstructive sleep apnea, 46% of long-haul truck drivers have this condition (42). One can surmise that there are significant numbers of undiagnosed and hence untreated individuals with obstructive sleep apnea in other transportation industries as well.

What to do About the Problem

There are three components to addressing the issue of sleepiness related fatigue in the transportation industry. The first, admission that a problem exists, has been increasingly recognized by policy makers, the industry and workers as reflected by statements and presentations by these parties. The second is appropriate revision of duty hour regulations to make them consistent with scientific evidence related to the effects of sleep deprivation, circadian misalignment and their impact on performance. To some extent, this has resulted in revision of duty hour regulations in the railroad and the aviation industries. However, as evidenced by the exception given to cargo airlines, not all workers are covered. Moreover, a portion of the hours of service regulation for trucking that was enacted in 2011 has been recently rescinded, eliminating mandated rest. Additional changes are needed, but are difficult to implement because of the financial impacts they might have on employers. One of the reasons that cargo airlines were exempted from the new duty and rest regulations was that the calculated financial cost exceeded any benefit irrespective of the impact on the personal lives of the employees (13). The third component is focused on operator education. The importance of this was recognized in the Rail Safety Improvement Act of 2008 (43). In the statute, each railroad was mandated to develop a “fatigue management plan” that needed to incorporate “Employee education and training on the physiological and human factors that affect fatigue, as well as strategies to reduce or mitigate the effects of fatigue, based on the most current scientific and medical research and literature”, as well as “Opportunities for identification, diagnosis, and treatment of any medical condition that may affect alertness or fatigue, including sleep disorders.” Studies have demonstrated that operator educational programs decrease fatigue related accidents. For example, in a recent study of Australian truck drivers, crash rates were higher among those who had not completed a fatigue management program (44).

Although individual industries and employers are at liberty to develop their own fatigue management educational programs, such efforts are not necessarily comprehensive or viewed by employees as containing unbiased information. Thus, there is a need to provide a source of information pertaining to sleep and circadian science, sleep disorders, fatigue/sleep deprivation mitigation strategies, self-evaluation assessment and pathways to seek treatment that is both scientifically accurate and unbiased to assist transportation workers, their families as well as other interested parties. To achieve the most impact, education should be customized to the industry, using the specific industry “language” and fatigue-driven scenarios that apply to the workers in that industry. Consequently, there is an opportunity for disinterested third parties to develop educational fatigue management resources. An example is the educational website, http://www.railroadersleep.org, developed by Division of Sleep Medicine at Harvard Medical School under contract from the Volpe National Transportation Center and the Federal Rail Administration. Other resources can be found at websites sponsored by the American Academy of Sleep Medicine http://www.sleepeducation.com and the National Sleep Foundation (http://sleepfoundation.org).

Fatigue related to sleep deprivation remains commonplace in the transportation industries. Crashes caused by fatigue can have catastrophic consequences on both societal and personal levels. There needs to be greater action to eliminate these events including appropriate revision of duty hour regulations using the best available scientific evidence as well as individual operator education on ways to recognize and mitigate fatigue related to sleep deprivation.

Acknowledgements

Partially supported by Department of Transportation Contract #DTRT57-10-C-10030

References

  1. National transportation safety board. ntsb cites crew sleep apnea in 2001 Michigan rail accident. 11/19/2002. Available at : http://www.ntsb.gov/news/press-releases/Pages/NTSB_Cites_Crew_Sleep_Apnea_in_2001_Michigan_Rail_Accident.aspx (accessed 3/9/15).
  2. National Transportation Safety Board. Crash during a nighttime nonprecision instrument approach to landing, UPS flight 1354. 9/9/2014. Available at: http://www.ntsb.gov/investigations/AccidentReports/Pages/AAR1402.aspx (accessed 3/9/15).
  3. Carroll JR. Pilots reported fatigue, erred in UPS jet crash. USAToday. February 20, 2014. Available at: http://www.usatoday.com/story/news/nation/2014/02/20/ntsb-ups-jet-crash/5644777/ (accessed 3/9/15).
  4. Collision Avoidance Working Group. 65 Main-Track Train Collisions, 1997 through 2002: Review, Analysis, Findings, and Recommendations. August, 2006. http://www.fra.dot.gov/Elib/Document/1575 (accessed 3/9/15).
  5. Molitoris JM. Statement of Jolene M. Molitoris, Federal Railroad Administrator, U. S. Department of Transportation before the Senate Committee on Commerce, Science, and Transportation Subcommittee on Surface Transportation and Merchant Marine, September 16, 1998. http://testimony.ost.dot.gov/test/pasttest/98test/Molo6.htm (accessed 3/9/15).
  6. Sumwalt R. Reduce aviation accidents and incidents caused by fatigue: It’s time to Act! https://www.faa.gov/about/office_org/headquarters_offices/avs/offices/afs/afs200/media/aviation_fatigue_symposium/8-19_Sumwalt.pdf (accessed 3/9/15).
  7. Wald ML. Pilots Set Up for Fatigue, Officials Say. NY Times, May 13, 2009. http://www.nytimes.com/2009/05/14/nyregion/14pilot.html?_r=0 (accessed 3/9/15).
  8. Schultz, S. NTSB: Deadly 2011 Bus Crash Caused By Fatigue, Speed, Poor Oversight. http://www.wibw.com/home/headlines/NTSB_Deadly_2011_Bus_Crash_Caused_By_Fatigue_Speed_Poor_Oversight__157387065.html (accessed 3/9/15).
  9. Porter D. Tracy Morgan accident: Another case of trucker fatigue? Christian Science Monitor, June 10, 2014. http://www.csmonitor.com/USA/Latest-News-Wires/2014/0610/Tracy-Morgan-accident-Another-case-of-trucker-fatigue (accessed 3/9/15).
  10. Anonymous. Board meeting: collision between two massachusetts bay transportation authority green line trains, Newton, Massachusetts, May 28, 2008. http://www.ntsb.gov/news/events/Pages/Collision_Between_Two_Massachusetts_Bay_Transportation_Authority_Green_Line_Trains_Newton_Massachusetts_May_28_2008.aspx11 (accessed 3/9/15).
  11. Anonymous. How the new rail safety act affects you. http://www.utu.org/worksite/safety/safetyact2008.htm (3/9/15).
  12. Department of Transportation. Federal Aviation Administration. 14 CFR Parts 117, 119 and 121. Flightcrew Member Duty and Rest Requirements. Federal Register. Vol 77, No. 2. Wednesday, January 4, 2012.
  13. Press Release – FAA Issues Final Rule on Pilot Fatigue. http://www.faa.gov/news/press_releases/news_story.cfm?newsId=13272 (accessed 3/9/15).
  14. Summary of Hours of Service Regulations. Federal Motor Carrier Safety Administration. http://www.fmcsa.dot.gov/regulations/hours-service/summary-hours-service-regulations (accessed 3/9/15).
  15. Bourgeois-Bougrine S, Carbon P, Gounelle C, Mollard R, Coblentz A. Perceived fatigue for short- and long-haul flights: a survey of 739 airline pilots. Aviat Space Environ Med. 2003;74(10):1072-7. [PubMed]
  16. Drury DA, Ferguson SA, Thomas MJ. Restricted sleep and negative affective states in commercial pilots during short haul operations. Accid Anal Prev. 2012;45 Suppl:80-4. [CrossRef] [PubMed]
  17. Pollard JK. Locomotive Engineer's Activity Diary.1996. http://www.fra.dot.gov/eLib/details/L04244 (accessed 3/9/15).
  18. Thomas GR, Raslear TG and Kuehn GI. The Effects of Work Schedule on Train Handling Performance and Sleep of Locomotive Engineers: A Simulator Study.1997.  http://www.fra.dot.gov/eLib/details/L04245 (accessed 3/9/15).
  19. Dingus TA, Neale VL, Garness SA, Hanowski RJ, Keisler AS, Lee SE, Perez MA, Robinson GS, Belz SM, Casali JG, Pace-Schott EF, Stickgold RA, Hobson JA, July 2002. Impact of sleeper berth usage on driver fatigue: Final project report. Contract No. DTFH61-96-00068. U.S. Department of Transportation, Federal Motor Carriers Safety Administration, Washington, DC.
  20. Hanowski RJ, Wierwille WW, Dingus TA. An on-road study to investigate fatigue in local/short haul trucking, Accid Anal Prev. 2003;35:153-60. [CrossRef] [PubMed]
  21. Mitler MM, Miller JC, Lipsitz JJ, Walsh JK, Wylie CD., The sleep of long-haul truck drivers, New Engl J Med. 1997;337:755-61. [CrossRef] [PubMed]
  22. Hanowski RJ, Hickman J, Fumero MC, Olson RL, Dingus TA. The sleep of commercial vehicle drivers under the 2003 hours-of-service regulations. Accid Anal Prev. 2007;39(6):1140-5. [CrossRef] [PubMed]
  23. Budhiraja R and Quan SF. Sleep-disordered breathing and cardiovascular health. Curr Opin Pulm Med. 2005;11(6):501-6. [CrossRef] [PubMed]
  24. Budhiraja R, Sharief I, Quan SF. Sleep disordered breathing and hypertension. J Clin Sleep Med. 2005;1(4):401-4. [PubMed]
  25. Quan SF. Sleep Disturbances and their Relationship to Cardiovascular Disease. Am J Lifestyle Med. 2009;3(1 suppl):55s-59s. [CrossRef] [PubMed]
  26. Straif K, Baan R, Grosse Y, et al. Carcinogenicity of shift-work, painting, and firefighting. Lancet Oncol. 2007;8(12):1065-66. [CrossRef] [PubMed]
  27. Durmer JS, Dinges DF. Neurocognitive consequences of sleep deprivation. Semin Neurol. 2005;25(1):117-29. [CrossRef] [PubMed]
  28. Goel N, Rao H, Durmer JS, et al. Neurocognitive consequences of sleep deprivation. Semin Neurol 2009;29(4):320-39. [CrossRef] [PubMed]
  29. Bonnet MH, Arand DL. Clinical effects of sleep fragmentation versus sleep deprivation. Sleep Med Rev 2003;7(4):297-310. [CrossRef] [PubMed]
  30. Plante DT, Winkelman JW. Sleep disturbance in bipolar disorder: therapeutic implications. Am J Psychiatry. 2008;165(7):830-43. [CrossRef] [PubMed]
  31. Killgore WD, Balkin TJ, Wesensten NJ. Impaired decision making following 49 h of sleep deprivation. J Sleep Res. 2006;15(1):7-13. [CrossRef] [PubMed]
  32. Holland DW. The effect of shiftwork related fatigue on the family life of train operators: implications for safety and health professionals. Work. 2006;26(2):115-121. [PubMed]
  33. Ku CH, Smith MJ. Organisational factors and scheduling in locomotive engineers and conductors: Effects on fatigue, health and social well-being. Appl Ergon. 2010;41(1):62-71. [CrossRef] [PubMed]
  34. Cooper CL, Sloan S. Occupational and psychosocial stress among commercial aviation pilots. J Occup Med. 1985;27(8):570-6. [CrossRef] [PubMed]
  35. Williamson A, Friswell R. The effect of external non-driving factors, payment type and waiting and queuing on fatigue in long distance trucking. Accid Anal Prev. 2013;58:26-34. [CrossRef] [PubMed]
  36. Young T, Palta M, Dempsey J, et al. The occurrence of sleep-disordered breathing among middle-aged adults. N Engl J Med. 1993;328(17):1230-5. [CrossRef] [PubMed]
  37. Adams R, Appleton S, Vakulin A, Taylor A, Martin S, Catcheside P, Antic N, Mcevoy D, Wittert G. High Prevalence Of Undiagnosed OSA In A Community Sample Of Men Aged 40 Years And Over. Sleep Biol Rhythms. 2012;10 (Suppl 1): 1-74.
  38. Kapur V, Strohl KP, Redline S, et al. Underdiagnosis of sleep apnea syndrome in U.S. communities. Sleep Breath. 2002;6(2):49-54. [CrossRef] [PubMed]
  39. Klink M, Quan SF. Prevalence of reported sleep disturbances in a general adult population and their relationship to obstructive airways diseases. Chest. 1987;91(4):540-6. [CrossRef] [PubMed]
  40. Klink ME, Quan SF, Kaltenborn WT, et al. Risk factors associated with complaints of insomnia in a general adult population. Influence of previous complaints of insomnia. Arch Intern Med 1992;152(8):1634-7. [CrossRef] [PubMed]
  41. Walsh JK. Clinical and socioeconomic correlates of insomnia. J Clin Psychiatry. 2004;65 Suppl 8:13-9. [PubMed]
  42. Stoohs RA, Bingham LA, Itoi A, et al. Sleep and sleep-disordered breathing in commercial long-haul truck drivers. Chest 1995;107(5):1275-82. [CrossRef] [PubMed]
  43. Anonymous . The Railroad Fatigue Risk Management Program at the Federal Railroad Administration:Past, Present and Future.2006. http://www.fra.dot.gov/eLib/Details/L04335 (accessed 3/9/15).
  44. Meuleners L, Fraser ML, Govorko MH, Stevenson MR. Obstructive Sleep Apnea, Health-Related Factors, and Long Distance Heavy Vehicle Crashes in Western Australia: A Case Control Study. J Clin Sleep Med. 2015 Jan 12. pii: jc-00403-14. [Epub ahead of print] [PubMed]

Reference as: Quan SF, Barger LK. Brief review: sleep health and safety for transportation workers. Southwest J Pulm Crit Care. 2015;10(3):130-9. doi: http://dx.doi.org/10.13175/swjpcc036-15 PDF

Friday
Jul252014

Lack of Impact of Mild Obstructive Sleep Apnea on Sleepiness, Mood and Quality of Life

Stuart F. Quan, M.D.1,2,6

Rohit Budhiraja, M.D.3

Salma Batool-Anwar, M.D., M.P.H.2

Daniel J. Gottlieb, M.D., M.P.H.1,2,4

Phillip Eichling, M.D., M.P.H.7,8

Sanjay Patel, M.D., M.S.1,2

Wei Shen, M.D.6,9

James K. Walsh, Ph.D.5

Clete A. Kushida, M.D., Ph.D.10


1Division of Sleep Medicine, Harvard Medical School, Boston, MA

2Division of Sleep and Circadian Disorders, Brigham and Women’s Hospital, Boston, MA

3Department of Medicine, Tufts University School of Medicine, Boston, MA

4VA Boston Healthcare System, Boston, MA

S5leep Medicine and Research Center, St. Luke's Hospital, Chesterfield, MO

6Arizona Respiratory Center, University of Arizona, Tucson, AZ

7College of Medicine, University of Arizona, Tucson, AZ

8Comprehensive Sleep Solutions, Tucson, AZ

9Southern Arizona VA Health Care System, Tucson, AZ

10Stanford University Sleep Clinic and Center for Human Sleep Research, Redwood City, CA


Abstract

Background and Objectives: Obstructive sleep apnea (OSA) is associated with sleepiness, depression and reduced quality of life. However, it is unclear whether mild OSA has these negative impacts. Using data from the Apnea Positive Pressure Long-term Efficacy Study (APPLES), this study determined whether participants with mild OSA had greater sleepiness, more depressive symptoms and poorer quality of life in comparison to those without OSA.

Methods: 239 persons evaluated for participation in APPLES with a baseline apnea hypopnea index (AHI) < 15 /hour were assigned to 1 of 2 groups: No OSA (N=40, AHI < 5 /hour) or Mild OSA (N=199, 5 to <15 /hour) based on their screening polysomnogram. Scores on their Epworth Sleepiness Scale (ESS), Stanford Sleepiness Scale (SSS), Hamilton Rating Scale for Depression (HAM-D), Profile of Mood States (POMS) and Sleep Apnea Quality of Life Index (SAQLI) were compared between groups.

Results: There were no significant differences between the No OSA and Mild OSA groups on any of the 5 measures: ESS (No OSA, 9.8 + 3.5 vs Mild OSA, 10.6 + 4.3, p=0.26), SSS,(2.8 + 0.9 vs. 2.9 + 1.0, p=0.52), HAM-D (4.6 + 3.0 vs. 4.9 + 4.7, p=0.27), POMS (33.5 + 22.3 vs. 28.7 + 22.0, p=0.70), SAQLI (4.5 + 0.8 vs. 4.7 + 0.7, p=0.39).

Conclusion: Individuals with mild OSA in this cohort do not have worse sleepiness, mood or quality of life in comparison to those without OSA.

For accompanying editorial click here.

Abbreviations

AHI                Apnea Hypopnea Index

APPLES           Apnea Long-term Efficacy Study

BMI                Body Mass Index

HAM-D           Hamilton Rating Scale for Depression

IRB                Institutional Review Board

ESS                Epworth Sleepiness Scale

OSA               Obstructive Sleep Apnea

PSG                Polysomnogram

POMS              Profile of Mood States

RDI                 Respiratory Disturbance Index

SAQLI             Sleep Apnea Quality of Life Index

SSS                Stanford Sleepiness Scale

WAIS              Wechsler Adult Intelligence Scale

Introduction

Obstructive sleep apnea (OSA) is an important sleep related breathing disorder with prevalence rates between 3-17% in men and 3-9% in women (1,2). With the rising trend of obesity, it is becoming increasingly more common (2,3). In a number of longitudinal cohort studies, severe OSA is associated with an increased incidence of hypertension, cardiovascular disease and death (4-9). It also is adversely associated with a number of neurocognitive and behavioral outcomes including depression (10), sleepiness (11), and poor quality of life (12).

The most commonly used metric to classify severity of OSA is the apnea-hypopnea index (AHI) which is the number of apnea or hypopnea events per hour of sleep. Persons with an AHI < 5 are not considered to have OSA (13). In contrast, an AHI > 5 and < 15, AHI > 15 and <30, and an AHI > 30 are classified as mild, moderate, and severe respectively (14). It is generally accepted that OSA can negatively impact mood, wakefulness and quality of life. However, it is unclear whether mild OSA can have such effects (10, 11, 15). Epidemiological studies have generally shown that individuals with OSA are sleepier than those without OSA (16). Existing data in persons with mild OSA referred to sleep clinics are either limited primarily to assessments of sleepiness or have conflicting results (12, 17, 18).

The Apnea Positive Pressure Long-term Efficacy Study (APPLES) is a randomized, double-blinded, sham-controlled, multi-center trial of continuous positive airway pressure (CPAP) therapy designed to determine whether CPAP improves neu­rocognitive function over a 6-month test period (19). The present study is an analysis of the relationship between assessments of mood, sleepiness and quality of life in those without OSA versus mild OSA at the baseline visit (pre-randomization) in those screened for participation in APPLES. Our intent was to determine whether there was any association between mild OSA and these domains.

Methods

Participants and Study Design

The study design, recruitment procedures, and inclusion and exclusion criteria for APPLES have been described extensively (19). The institutional review board (IRB) at each site approved the study protocol. Briefly, APPLES was a multisite study conducted at 5 clinical centers: Stanford University, Stanford, CA; University of Arizona, Tucson, AZ; Providence St. Mary Medical Center, Walla Walla, WA; St. Luke’s Hospital, Chesterfield, MO; and Brigham and Women’s Hospital, Boston, MA. Participants were recruited into the study primarily from patients scheduled into a regular sleep clinic for evaluation of possible OSA, and from local adver­tising. Recruitment began in November 2003 and was completed in August 2008. Initial enrollment required age > 18 years and clinical symptoms of OSA, as defined by American Academy of Sleep Medicine (AASM) criteria (14). At enrollment, participants underwent a screening diagnostic polysomnogram (PSG) and baseline neurocognitive testing including the standardized assessments described below. Only participants with an apnea hypopnea index (AHI) > 10 events per hour continued to the clinical trial and were randomized subsequently to sham or active CPAP for 6 months as previously reported (19). Excluded were individuals who had 1) prior OSA treatment with CPAP or surgery, 2) household members with current/past CPAP use, 3) a sleepiness-related automobile accident within the year prior to potential enrollment, (4) oxygen saturations < 75% for > 10% of the diagnostic polysomnogram (PSG) total sleep time; or (5) conditions or use of medications that could potentially affect neurocognitive function and/or alertness. For the pres­ent analysis, data from both randomized and non randomized participants at the time of the screening polysomnography visit were utilized. In addition to new information, some of the material related to sleepiness reported herein represent reanalysis of data in a different format from what has been published in a previous paper (20).

Polysomnography

Polysomnography was conducted as previously described using signals from a nasal pressure cannula, nasal/oral thermistor, thoracic and abdominal piezo bands, and a pulse oximeter to classify apnea and hypopnea events. An apnea was identified by a > 90% amplitude decrease from baseline of the nasal pressure signal lasting > 10 sec. Hypopneas were scored if there was a > 50%, but < 90% decrease from baseline of the nasal pressure signal, or if there was a clear amplitude reduction of the nasal pressure signal that did not reach the above criterion but it was associ­ated with either an oxygen desaturation > 3% or an arousal, and the event duration was ≥ 10 seconds. Obstructive apneas were identified by persistence of chest or abdominal respiratory effort during flow cessation. Central apneas were noted if no displacement occurred on either the thoracic or abdominal chan­nels. All studies were scored at the central reading center located at Stanford University.

Assessments of Sleepiness

Epworth Sleepiness Scale (ESS): The ESS is a validated self-administered questionnaire that asks an individual to rate his or her probability of falling asleep on a scale of increasing probability from 0 to 3 in 8 different situations (21). The scores for the 8 questions are summed to obtain a single score from 0 to 24 that is indicative of self-reported sleep propensity. The ESS prior to randomization was administered at the time of the clinical evaluation and on the night of the diagnostic PSG. The value at the time of the diagnostic PSG was used, but if not available, then the value at the time of the clinical evaluation was substituted.

Stanford Sleepiness Scale (SSS): The SSS asks a person to rate current moment sleepiness on a scale of one to seven (22). Each numerical rating has an associated descriptor, for exam­ple a rating of 1 is described as “feeling active, vital, alert, or wide awake,” while a rating of 7 is described as “no longer fighting sleep, sleep onset soon; having dream-like thoughts.” For APPLES the SSS was administered at 10:00, 12:00, 14:00, and 16:00 on the day following the diagnostic PSG; the variable analyzed was the mean score from these 4 trials. 

Assessments of Mood

Profile of Mood States (POMS): The POMS assesses mood by asking respondents how they feel at that moment according to a series of 65 descriptors such as “unhappy, tense or cheerful” (23). Possible responses are not at all, a little, moderately; quite a lot, extremely. Six mood states are used in the POMS: tension, depression, anger, vigor, fatigue, and confusion, which can be combined to form the total POMS mood disturbance score. Higher scores represent more negative mood states. For this analysis, total mood disturbance score was used.

Hamilton Rating Scale for Depression (HAM-D): The HAM-D is a validated 21-item clinician-administered assess­ment of the severity of depression (24). APPLES used a modified version of this test, the GRID Hamilton Rating Scale for De­pression that was developed through a broad-based inter­national consensus process to both simplify and standardize administration and scoring in clinical practice and research (25). In this scale, 17 items (e.g., depressed mood, suicide, work and anhedonia, retardation, agitation, gastrointestinal or general somatic symptoms, hypochondriasis, loss of insight or weight) are scored using either a 3- or 5-point scale based on intensity and frequency, and are summed to provide a single score. Higher scores reflect more depressive symptoms.

Quality of Life Assessment

Calgary Sleep Apnea Quality of Life Index (SAQLI): The SAQLI was developed as a sleep apnea specific quality of life instrument (26). It is a 35 item instrument that captures the adverse impact of sleep apnea on 4 domains: daily functioning, social interactions, emotional functioning and symptoms. Items are scored on a 7- point scale with “all of the time” and “not at all” being the most extreme responses. Item and domain scores are averaged to yield a composite total score between 1 and 7. Higher scores represent better quality of life.

Statistical Analyses

For this analysis, participants who had an AHI < 5 were assigned to the No OSA group, and those who had an AHI > 5, but < 15 were assigned to the Mild OSA group. Body mass index (BMI) was computed as weight (kg)/height (m)2. Participants’ race/ethnicity were classified as self-reported white or non-white. Marital status was categorized as married or not married. For continuous variables, unadjusted comparisons between the No OSA and Mild OSA groups were made using Student’s t-test. Differences in proportions were assessed using the χ2 test. Analysis of covariance was performed to adjust for differences in study site, age and BMI. Data are expressed as mean + standard deviation (SD) or percentages. P < 0.05 was considered statistically significant. Analyses were performed using IBM SPSS Statistics Version 20 (Chicago, IL).

Results

In Table 1 are shown the demographic data for the No OSA and Mild OSA groups.

Table 1: Demographic Information


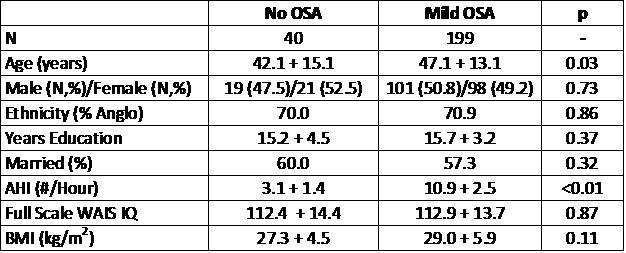
The groups were comparable with respect to gender, race, educational achievement, marital status and intelligence. By definition, the AHI for the Mild OSA group was significantly higher than for the No OSA group (10.9 + 2.5 vs. 3.1 + 1.4, p<0.01). However, participants in the No OSA were slightly younger than those in the Mild OSA group (42.1 + 15.1 vs. 47.1 + 13.1 years, p=0.03). There also was a slight trend for those in the Mild OSA group to have a higher BMI (27.3 + 4.5 vs. 29.0 + 5.9 kg/m2, p=0.11). Some differences related to study site were noted as well. For the HAM-D, there was a trend for the mean score of both groups combined to be higher at the Brigham and Women’s Hospital site [N=51] in comparison to the University of Arizona site [N=59] (6.1 + 5.3 vs. 3.6 + 3.6, p=0.046). Similarly, there was a trend for the ESS to be lower at the University of Arizona site [N=61] comparison to the St. Luke’s Hospital Site [N=29] (9.2 + 33 vs. 11.1 + 3.3, p=0.051).

Table 2 shows the comparisons between the No OSA and Mild OSA groups for the sleepiness, mood and quality of life metrics.

Table 2: Sleepiness, Mood and Quality of Life in No OSA and OSA Groups

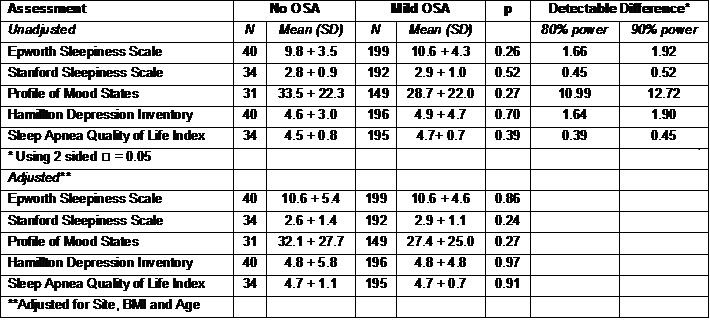
There were no statistically significant differences observed for any of these variables. The table also shows the power in this study to detect clinically significant differences in these metrics. As shown, there is 90% power to demonstrate a 1.92, 0.52, 12.72, 1.90 and 0.45 difference between groups in the ESS, SSS, POMS, HAM-D and SAQLI respectively. Furthermore, although the No OSA group was slightly younger, there were no significant correlations between age and the ESS, SSS, POMS, HAM-D, and the SAQLI (r values between 0.04 and 0.11).

Discussion

In this analysis, we show that using a commonly accepted definition of mild OSA, sleepiness and mood are not different in comparison to persons without significant OSA. Furthermore, there was no evidence that mild OSA negatively impacts quality of life. These data suggest that mild OSA as currently defined has little adverse impact on sleepiness, mood and quality of life.

We observed that there were no differences in the ESS between participants with No OSA in comparison to those with Mild OSA. Results from other large cohorts are conflicting. Our results are consistent with those of Lopes et al (12) who also did not find that the ESS was elevated in those with Mild OSA in a large population of patients undergoing PSG for suspected OSA. In contrast, a cohort of Chinese patients with mild OSA had a greater prevalence of subjective daytime sleepiness in comparison to those with primary snoring (18). However, the ESS was not higher in contrast to the Sleep Heart Health Study in which the ESS appeared to be greater in those with Mild OSA (16). Similarly, excessive daytime sleepiness was more commonly reported among a cohort of Japanese women participating in a cardiovascular risk study (17). In this latter study, OSA status was determined using pulse oximetry and not PSG. A number of other studies also have reported sleepiness data in subjects with mild OSA. However, small sample sizes, populations with specialized characteristics, and lack of specific comparisons between persons with mild OSA and no OSA limit their interpretability (27-32).

In this study, mood as assessed by the POMS and the HAM-D was not worse in the Mild OSA group. Although depressive symptoms and use of anti-depressants are commonly noted among patients with OSA (33-35), studies of whether mood is affected by mild OSA are few. In 2 studies performed in patients seen in an otolaryngology clinic (27, 31), the Beck's Depression Inventory (BDI) was not different in comparison to either a control group or primary snorers. Similarly, in a group of elderly Koreans referred to a sleep clinic, the BDI was not elevated in comparison to an age-matched control group (36). Our findings extend these previous reports by showing that using two different assessments of mood, there was no adverse impact of mild OSA.

Quality of life in this study was not affected by mild OSA. In contrast, in a number of studies, quality of life assessed with various instruments is impaired in persons with OSA (37-40). However, there are few studies in which the potential impact of mild OSA has been examined. In a relatively small study performed in patients from an otolaryngology clinic, scores on the SAQLI in patients with mild OSA were the same as a group of primary snorers (31). Similarly, in an analysis of 461 elderly women who underwent PSG in the Study of Osteoporotic Fractures cohort, scores on the Functional Outcomes of Sleep Questionnaire were the same across tertiles of OSA severity (41). Thus, our findings demonstrating a lack of association between mild OSA and quality of life are consistent with these previous studies.

Our failure to demonstrate an association between mild OSA and sleepiness, mood and quality of life provides additional data challenging the commonly used threshold for “defining disease” in the assessment of OSA. The traditional cutpoint of 5 originated more than 30 years ago when only apneic events were scored (42, 43). In the intervening years, it has been accepted that hypopneas have pathophysiologic significance and are now incorporated into the AHI (44). Additionally, some clinicians advocate including the more subtle respiratory effort related arousals into a broader respiratory disturbance index (RDI) (45). The data in this study suggest that at least for some domains of OSA symptomatology, mild OSA based on the application of current scoring criteria to older thresholds may in fact be part of a normal population.

Despite our findings, clinicians, insurers and policy makers should be cautioned about using the AHI as the sole metric in determining whether or not to treat an individual patient. The impact of OSA insofar as behavioral and neurocognitive domains are concerned appears to be quite heterogeneous. For example, 54% of individuals in the Sleep Heart Health Study with moderate to severe OSA were not sleepy on any one of 3 measures of sleepiness. Conversely, some individuals with less severe OSA may be sleepy (16). In our study, the mean ESS in both the No OSA and Mild OSA groups was above what would be expected for an unselected general population suggesting that other causes of sleepiness were present in the cohort (16). Thus, before deciding to initiate OSA specific treatment for Mild OSA, clinicians should consider whether there are other explanations for the patient’s symptoms, and not just treat the AHI.

This study does have three major limitations. First, it might be argued that our study was underpowered to detect small differences between the No OSA and Mild OSA groups. However, sufficient statistical power was present to detect clinically important differences (Table 2). For example, it has been proposed that the minimally important difference on repeated administrations of the SAQLI is approximately 1 (46). Our results demonstrated that we had 90% power to detect a change of 0.5. Moreover, our findings are consistent with the limited number of studies previously performed. Second, our participants were a mixture of individuals recruited from sleep clinics and those responding to advertisements. Thus, they may not be representative of the general populace. Third, it is possible that the No OSA group included some individuals who actually had mild OSA. Inasmuch as all participants were considered by clinicians to have symptoms consistent with OSA, some individuals in the No OSA group may have had falsely “negative” PSGs. Such misclassification would bias towards a null effect. The extent to which this occurred is not known, but night to night variability of the AHI is relatively low (47). Thus, we suspect this potential bias is small. Despite these limitations, however, the APPLES cohort was geographically and ethnically diverse, and had a representative gender distribution.

In conclusion, evidence from this analysis does not indicate that mild OSA has any impact on sleepiness, mood or quality of life. This raises concerns whether the current AHI criteria for distinguishing mild OSA from no clinically significant OSA needs to be reassessed. Nevertheless, additional comparisons between individuals who are truly without OSA symptoms and those with mild OSA as currently defined need to be performed before a final conclusion can be determined.  

References 

  1. Punjabi NM. The epidemiology of adult obstructive sleep apnea. Proc Am Thorac Soc. 2008;5(2):136-143. [CrossRef] [PubMed]
  2. Peppard PE, Young T, Barnet JH, Palta M, Hagen EW, Hla KM. Increased prevalence of sleep-disordered breathing in adults. Am J Epidemiol. 2013;177(9):1006-1014. [CrossRef] [PubMed]
  3. Inge TH, King WC, Jenkins TM, et al. The effect of obesity in adolescence on adult health status. Pediatrics. 2013;132(6):1098-1104. [CrossRef] [PubMed]
  4. Peppard PE, Young T, Palta M, Skatrud J. Prospective study of the association between sleep-disordered breathing and hypertension. N Engl J Med. 2000;342(19):1378-84. [CrossRef] [PubMed]
  5. Young T, Finn L, Peppard PE, et al. Sleep disordered breathing and mortality: eighteen-year follow-up of the Wisconsin sleep cohort. Sleep. 2008;31(8):1071-1078. [PubMed]
  6. Gottlieb DJ, Yenokyan G, Newman AB, et al. Prospective study of obstructive sleep apnea and incident coronary heart disease and heart failure: the sleep heart health study. Circulation. 2010;122(4):352-360. [CrossRef] [PubMed]
  7. Marshall NS, Wong KK, Liu PY, Cullen SR, Knuiman MW, Grunstein RR. Sleep apnea as an independent risk factor for all-cause mortality: the Busselton Health Study. Sleep. 2008;31(8):1079-1085. [PubMed]
  8. Punjabi NM, Caffo BS, Goodwin JL, et al. Sleep-disordered breathing and mortality: a prospective cohort study. PLoS Med . 2009;6(8):e1000132. [CrossRef] [PubMed]
  9. Marin JM, Carrizo SJ, Vicente E, Agusti AG. Long-term cardiovascular outcomes in men with obstructive sleep apnoea-hypopnoea with or without treatment with continuous positive airway pressure: an observational study. Lancet. 2005;365(9464):1046-1053. [CrossRef] [PubMed]
  10. Schroder CM, O'Hara R. Depression and Obstructive Sleep Apnea (OSA). Ann Gen Psychiatry. 2005;4:13. [PubMed]
  11. Jordan AS, McSharry DG, Malhotra A. Adult obstructive sleep apnoea. Lancet. 2014;383(9918):736-747. [CrossRef] [PubMed]
  12. Lopes C, Esteves AM, Bittencourt LRA, Tufik S, Mello MT. Relationship between the quallity of life and the severity of obstructive sleep apnea syndrome. Braz J Med Biol Res. 2008;41(10):908-913. [CrossRef] [PubMed]
  13. Sateia MJ. International Classification of Sleep Disorders 2nd ed. Westchester, IL: American Academy of Sleep Medicine, 2005; 297.
  14. American Academy of Sleep Medicine Taskforce. Sleep-Related Breathing Disorders In Adults: Recommendations For Syndrome Definition And Measurement Techniques In Clinical Research. Sleep. 1999;22 (5): 667-689. [PubMed]
  15. Ayas NT, Hirsch AA, Laher I, et al. New frontiers in obstructive sleep apnoea. Clin Sci (Lond). 2014;127(4):209-216. [CrossRef] [PubMed]c
  16. Gottlieb DJ, Whitney CW, Bonekat WH, et al. Relation of sleepiness to respiratory disturbance index: the Sleep Heart Health Study. Am J Respir Crit Care Med . 1999;159(2):502-507. [CrossRef] [PubMed]
  17. Cui R, Tanigawa T, Sakurai S, et al. Associations of sleep-disordered breathing with excessive daytime sleepiness and blood pressure in Japanese women. Hypertens Res. 2008;31(3):501-506. [CrossRef] [PubMed]
  18. Chen R, Xiong KP, Lian YX, et al. Daytime sleepiness and its determining factors in Chinese obstructive sleep apnea patients. Sleep Breath. 2011;15(1):129-135. [CrossRef] [PubMed]
  19. Kushida CA, Nichols DA, Quan SF, et al. The Apnea Positive Pressure Long-term Efficacy Study (APPLES): rationale, design, methods, and procedures. J Clin Sleep Med. 2006;2(3):288-300. [PubMed]
  20. Quan SF, Chan CS, Dement WC, et al. The association between obstructive sleep apnea and neurocognitive performance--the Apnea Positive Pressure Long-term Efficacy Study (APPLES). Sleep. 2011;34(3):303-314B. [PubMed]
  21. Johns MW. A new method for measuring daytime sleepiness: the Epworth sleepiness scale. Sleep. 1991;14(6):540-545. [PubMed]
  22. Hoddes E, Dement W, Zarcone V. The development and use of the Stanford Sleepiness Scale (SSS). Psychophysiol. 1972;9:150.
  23. McNair DM, Lorr M, Droppleman L. Manual for the Profile of Mood States. San Diego, CA: Educational and Industrial Testing Service, 1971;
  24. Hamilton M. A rating scale for depression. J Neurol Neurosurg Psychiatry. 1960;2356-62.
  25. Williams JB, Kobak KA, Bech P, et al. The GRID-HAMD: standardization of the Hamilton Depression Rating Scale. Int Clin Psychopharmacol. 2008;23(3):120-129. [CrossRef] [PubMed]
  26. Flemons WW, Reimer MA. Development of a disease-specific health-related quality of life questionnaire for sleep apnea. Am J Respir Crit Care Med. 1998;158(2):494-503. [CrossRef] [PubMed]
  27. Ishman SL, Cavey RM, Mettel TL, Gourin CG. Depression, sleepiness, and disease severity in patients with obstructive sleep apnea. Laryngoscope. 2010;120(11):2331-2335. [CrossRef] [PubMed]
  28. Minoguchi K, Yokoe T, Tazaki T, et al. Silent brain infarction and platelet activation in obstructive sleep apnea. Am J Respir Crit Care Med. 2007;175(6):612-617. [CrossRef] [PubMed]
  29. Yoshino A, Higuchi M, Kawana F, et al. Risk factors for traffic accidents in patients with obstructive sleep apnea syndrome. Sleep Biol Rhythms. 2006;4144-152.
  30. Back L, Palomaki M, Piilonen A, Ylikoski J. Sleep-disordered breathing: radiofrequency thermal ablation is a promising new treatment possibility. Laryngoscope. 2001;111(3):464-471. [CrossRef] [PubMed]
  31. Balsevicius T, Uloza V, Sakalauskas R, Miliauskas S. Peculiarities of clinical profile of snoring and mild to moderate obstructive sleep apnea-hypopnea syndrome patients. Sleep Breath. 2012;16(3):835-843. [CrossRef] [PubMed]
  32. Lecube A, Sampol G, Lloberes P, et al. Asymptomatic sleep-disordered breathing in premenopausal women awaiting bariatric surgery. Obes Surg. 2010;20(4):454-461. [CrossRef] [PubMed]
  33. Saunamaki T, Jehkonen M. Depression and anxiety in obstructive sleep apnea syndrome: a review. Acta Neurol Scand. 2007;116(5):277-288. [CrossRef] [PubMed]
  34. Ohayon MM. The effects of breathing-related sleep disorders on mood disturbances in the general population. J Clin Psychiatry. 2003;64(10):1195-200; quiz, 1274-6. [CrossRef] [PubMed]
  35. Chandra RK, Epstein VA, Fishman AJ. Prevalence of depression and antidepressant use in an otolaryngology patient population. Otolaryngol Head Neck Surg. 2009;141(1):136-138. [CrossRef] [PubMed]
  36. Ju G, Yoon IY, Lee SD, Kim TH, Choe JY, Kim KW. Effects of sleep apnea syndrome on delayed memory and executive function in elderly adults. J Am Geriatr Soc. 2012;60(6):1099-1103. [CrossRef] [PubMed]
  37. Baldwin CM, Ervin AM, Mays MZ, et al. Sleep disturbances, quality of life, and ethnicity: the Sleep Heart Health Study. J Clin Sleep Med. 2010;6(2):176-183. [PubMed]
  38. Baldwin CM, Griffith KA, Nieto FJ, O'Connor GT, Walsleben JA, Redline S. The association of sleep-disordered breathing and sleep symptoms with quality of life in the Sleep Heart Health Study. Sleep. 2001;24(1):96-105.[PubMed]
  39. Isidoro SI, Salvaggio A, Bue AL, Romano S, Marrone O, Insalaco G. Quality of life in patients at first time visit for sleep disorders of breathing at a sleep centre. Health Qual Life Outcomes. 2013;11207.
  40. Stepnowsky C, Johnson S, Dimsdale J, Ancoli-Israel S. Sleep apnea and health-related quality of life in African-American elderly. Ann Behav Med. 2000;22(2):116-120. [CrossRef] [PubMed]
  41. Kezirian EJ, Harrison SL, Ancoli-Israel S, et al. Behavioral correlates of sleep-disordered breathing in older women. Sleep. 2007;30(9):1181-1188. [PubMed]
  42. Guilleminault C. Sleep and Breathing. In: Sleeping and Waking Disorders: Indications and Techiniques. Guilleminault C, ed. Menlo Park, CA: Addison-Wesley, 1982; 155-182
  43. Block AJ, Boysen PG, Wynne JW, Hunt LA. Sleep apnea, hypopnea and oxygen desaturation in normal subjects. N Engl J Med. 1979;300 (10):513-517. [CrossRef] [PubMed]
  44. Gould GA, Whyte KF, Rhind GB, et al. The sleep hypopnea syndrome. Am Rev Respir Dis .1988;137(4):895-898. [CrossRef] [PubMed]
  45. Pepin JL, Guillot M, Tamisier R, Levy P. The upper airway resistance syndrome. Respiration. 2012;83(6):559-566. [CrossRef] [PubMed]
  46. Flemons WW, Reimer MA. Measurement properties of the calgary sleep apnea quality of life index. Am J Respir Crit Care Med. 2002;165(2):159-164. [CrossRef]
  47. Quan SF, Griswold ME, Iber C, et al. Short-term variability of respiration and sleep during unattended nonlaboratory polysomnography--the Sleep Heart Health Study. Sleep. 2002;25(8):843-849. [PubMed]

Acknowledgements

APPLES was funded by contract 5UO1-HL-068060 from the National Heart, Lung and Blood Institute. The APPLES pilot studies were supported by grants from the American Academy of Sleep Medicine and the Sleep Medicine Education and Research Foundation to Stanford University and by the National Institute of Neurological Disorders and Stroke (N44-NS-002394) to SAM Technology. In addition, APPLES investigators gratefully recognize the vital input and support of Dr. Sylvan Green who died before the results of this trial were analyzed, but was instrumental in its design and conduct.

Administrative Core

Clete A. Kushida, MD, PhD; Deborah A. Nichols, MS; Eileen B. Leary, BA, RPSGT; Pamela R. Hyde, MA; Tyson H. Holmes, PhD; Daniel A. Bloch, PhD; William C. Dement, MD, PhD

Data Coordinating Center

Daniel A. Bloch, PhD; Tyson H. Holmes, PhD; Deborah A. Nichols, MS; Rik Jadrnicek, Microflow, Ric Miller, Microflow Usman Aijaz, MS; Aamir Farooq, PhD; Darryl Thomander, PhD; Chia-Yu Cardell, RPSGT; Emily Kees, Michael E. Sorel, MPH; Oscar Carrillo, RPSGT; Tami Crabtree, MS; Booil Jo, PhD; Ray Balise, PhD; Tracy Kuo, PhD

Clinical Coordinating Center

Clete A. Kushida, MD, PhD, William C. Dement, MD, PhD, Pamela R. Hyde, MA, Rhonda M. Wong, BA, Pete Silva, Max Hirshkowitz, PhD, Alan Gevins, DSc, Gary Kay, PhD, Linda K. McEvoy, PhD, Cynthia S. Chan, BS, Sylvan Green, MD

Clinical Centers

Stanford University

Christian Guilleminault, MD; Eileen B. Leary, BA, RPSGT; David Claman, MD; Stephen Brooks, MD; Julianne Blythe, PA-C, RPSGT; Jennifer Blair, BA; Pam Simi, Ronelle Broussard, BA; Emily Greenberg, MPH; Bethany Franklin, MS; Amirah Khouzam, MA; Sanjana Behari Black, BS, RPSGT; Viola Arias, RPSGT; Romelyn Delos Santos, BS; Tara Tanaka, PhD

University of Arizona

Stuart F. Quan, MD; James L. Goodwin, PhD; Wei Shen, MD; Phillip Eichling, MD; Rohit Budhiraja, MD; Charles Wynstra, MBA; Cathy Ward, Colleen Dunn, BS; Terry Smith, BS; Dane Holderman, Michael Robinson, BS; Osmara Molina, BS; Aaron Ostrovsky, Jesus Wences, Sean Priefert, Julia Rogers, BS; Megan Ruiter, BS; Leslie Crosby, BS, RN

St. Mary Medical Center

Richard D. Simon Jr., MD; Kevin Hurlburt, RPSGT; Michael Bernstein, MD; Timothy Davidson, MD; Jeannine Orock-Takele, RPSGT; Shelly Rubin, MA; Phillip Smith, RPSGT; Erica Roth, RPSGT; Julie Flaa, RPSGT; Jennifer Blair, BA; Jennifer Schwartz, BA; Anna Simon, BA; Amber Randall, BA

St. Luke’s Hospital

James K. Walsh, PhD, Paula K. Schweitzer, PhD, Anup Katyal, MD, Rhody Eisenstein, MD, Stephen Feren, MD, Nancy Cline, Dena Robertson, RN, Sheri Compton, RN, Susan Greene, Kara Griffin, MS, Janine Hall, PhD

Brigham and Women’s Hospital

Daniel J. Gottlieb, MD, MPH, David P. White, MD, Denise Clarke, BSc, RPSGT, Kevin Moore, BA, Grace Brown, BA, Paige Hardy, MS, Kerry Eudy, PhD, Lawrence Epstein, MD, Sanjay Patel, MD

*Sleep HealthCenterscfor the use of their clinical facilities to conduct this research

Consultant Teams

Methodology Team: Daniel A. Bloch, PhD, Sylvan Green, MD, Tyson H. Holmes, PhD, Maurice M. Ohayon, MD, DSc, David White, MD, Terry Young, PhD

Sleep-Disordered Breathing Protocol Team: Christian Guilleminault, MD, Stuart Quan, MD, David White, MD

EEG/Neurocognitive Function Team: Jed Black, MD, Alan Gevins, DSc, Max Hirshkowitz, PhD, Gary Kay, PhD, Tracy Kuo, PhD

Mood and Sleepiness Assessment Team: Ruth Benca, MD, PhD, William C. Dement, MD, PhD, Karl Doghramji, MD, Tracy Kuo, PhD, James K. Walsh, PhD

Quality of Life Assessment Team: W. Ward Flemons, MD, Robert M. Kaplan, PhD

APPLES Secondary Analysis-Neurocognitive (ASA-NC) Team: Dean Beebe, PhD, Robert Heaton, PhD, Joel Kramer, PsyD, Ronald Lazar, PhD, David Loewenstein, PhD, Frederick Schmitt, PhD

National Heart, Lung, and Blood Institute (NHLBI)

Michael J. Twery, PhD, Gail G. Weinmann, MD, Colin O. Wu, PhD

Data and Safety Monitoring Board (DSMB)

Seven year term: Richard J. Martin, MD (Chair), David F. Dinges, PhD, Charles F. Emery, PhD, Susan M. Harding MD, John M. Lachin, ScD, Phyllis C. Zee, MD, PhD

Other term: Xihong Lin, PhD (2 yrs), Thomas H. Murray, PhD (1 yr).

None of the authors claim any conflicts of interest relevant to the article.

Reference as: Quan SF, Budhiraja R, Batool-Anwar S, Gottlieb DJ, Eichling P, Patel S, Shen W, Walsh JK, Kushida CA. Lack of impact of mild obstructive sleep apnea on sleepiness, mood and quality of life. Southwest J Pulm Crit Care. 2014;9(1):44-56. doi: http://dx.doi.org/10.13175/swjpcc082-14 PDF

Page 1 ... 3 4 5 6 7 ... 8 Next 5 Entries ยป