Search Journal-type in search term and press enter
Southwest Pulmonary and Critical Care Fellowships
In Memoriam

General Medicine

(Click on title to be directed to posting, most recent listed first)

Infectious Diseases Telemedicine to the Arizona Department of Corrections
   During SARS-CoV-2 Pandemic. A Short Report.
The Potential Dangers of Quality Assurance, Physician Credentialing and
   Solutions for Their Improvement (Review)
Results of the SWJPCC Healthcare Survey
Who Are the Medically Poor and Who Will Care for Them?
Tacrolimus-Associated Diabetic Ketoacidosis: A Case Report and Literature 
   Review
Nursing Magnet Hospitals Have Better CMS Hospital Compare Ratings
Publish or Perish: Tools for Survival
Is Quality of Healthcare Improving in the US?
Survey Shows Support for the Hospital Executive Compensation Act
The Disruptive Administrator: Tread with Care
A Qualitative Systematic Review of the Professionalization of the 
   Vice Chair for Education
Nurse Practitioners' Substitution for Physicians
National Health Expenditures: The Past, Present, Future and Solutions
Credibility and (Dis)Use of Feedback to Inform Teaching : A Qualitative
Case Study of Physician-Faculty Perspectives
Special Article: Physician Burnout-The Experience of Three Physicians
Brief Review: Dangers of the Electronic Medical Record
Finding a Mentor: The Complete Examination of an Online Academic 
   Matchmaking Tool for Physician-Faculty
Make Your Own Mistakes
Professionalism: Capacity, Empathy, Humility and Overall Attitude
Professionalism: Secondary Goals 
Professionalism: Definition and Qualities
Professionalism: Introduction
The Unfulfilled Promise of the Quality Movement
A Comparison Between Hospital Rankings and Outcomes Data
Profiles in Medical Courage: John Snow and the Courage of
   Conviction
Comparisons between Medicare Mortality, Readmission and
   Complications
In Vitro Versus In Vivo Culture Sensitivities:
   An Unchecked Assumption?
Profiles in Medical Courage: Thomas Kummet and the Courage to
   Fight Bureaucracy
Profiles in Medical Courage: The Courage to Serve
and Jamie Garcia
Profiles in Medical Courage: Women’s Rights and Sima Samar
Profiles in Medical Courage: Causation and Austin Bradford Hill
Profiles in Medical Courage: Evidence-Based 
Medicine and Archie Cochrane
Profiles of Medical Courage: The Courage to Experiment and 
   Barry Marshall
Profiles in Medical Courage: Joseph Goldberger,
   the Sharecropper’s Plague, Science and Prejudice
Profiles in Medical Courage: Peter Wilmshurst,
   the Physician Fugitive
Correlation between Patient Outcomes and Clinical Costs
   in the VA Healthcare System
Profiles in Medical Courage: Of Mice, Maggots 
   and Steve Klotz
Profiles in Medical Courage: Michael Wilkins
   and the Willowbrook School
Relationship Between The Veterans Healthcare Administration
   Hospital Performance Measures And Outcomes 


Although the Southwest Journal of Pulmonary and Critical Care was started as a pulmonary/critical care/sleep journal, we have received and continue to receive submissions that are of general medical interest. For this reason, a new section entitled General Medicine was created on 3/14/12. Some articles were moved from pulmonary to this new section since it was felt they fit better into this category.

-------------------------------------------------------------------------------------

Entries in healthcare (3)

Friday
Jan032020

Results of the SWJPCC Healthcare Survey

Richard A. Robbins, MD

Phoenix Pulmonary and Critical Care Research and Education Foundation

Gilbert, AZ USA 

Michael B. Gotway, MD

Department of Radiology

Mayo Clinic Arizona

Scottsdale, AZ USA

Julene R. Robbins, PhD, NCSP

Phoenix Pulmonary and Critical Care Research and Education Foundation

Gilbert, AZ USA

Lewis Wesselius, MD

Department of Pulmonary Medicine

Mayo Clinic Arizona

Scottsdale, AZ USA


Abstract

Debate is ongoing on how best to pay for healthcare, with a public option gaining increasing popularity. However, the Southwest US has traditionally been politically conservative and, although population demographics are rapidly shifting towards minorities, this shift is not reflected in the physician population. We conducted a voluntary, anonymous, on-line survey of the Southwest Journal of Pulmonary and Critical Care (SWJPCC) readership to determine if their attitudes differed from the public and/or nationwide surveys of physicians. The respondents, nearly all subspecialty care physicians, were universally consistent in their opinion that healthcare costs too much in the US. About two-thirds felt healthcare is a right. Administrative costs and insurance companies were viewed by most as the culprits for the high costs and hospital administrators and insurance company personnel were perceived as overpaid. Few viewed the electronic medical record as helpful in healthcare. These results seem mostly consistent with other Nationwide physician surveys. 

Introduction

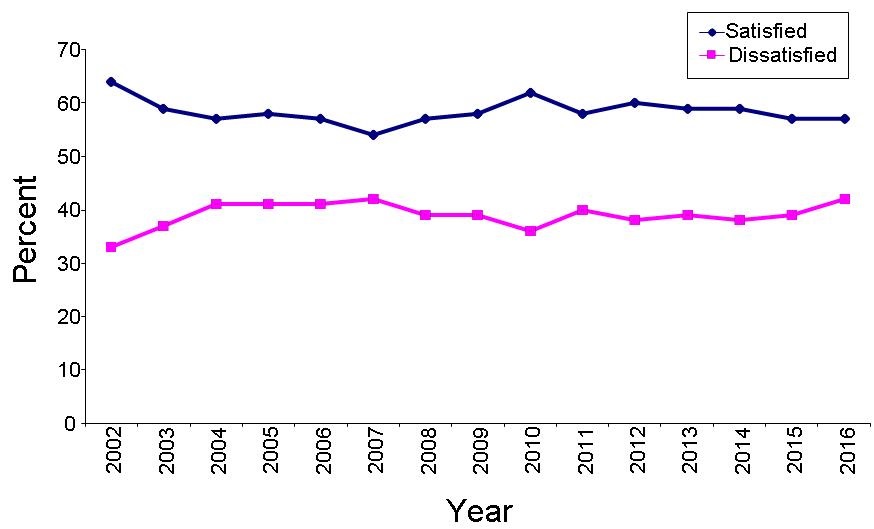
Most Americans continue to see healthcare costs in the U.S. as a major issue, with 79% dissatisfied with healthcare costs (1). Americans who are covered by Medicare or Medicaid are the least dissatisfied (29%), while dissatisfaction is highest among the uninsured (62%) and averages 48% among those with private insurance (2). This dissatisfaction has been reflected in the current political debates with proposals including public options such as “Medicare for All”.

Physicians have also become increasingly dissatisfied with healthcare (3). A variety of factors, such as electronic medical records, income instability and fairness, and the burden of regulations have been identified as affecting physician satisfaction and each is also affected by cost (3). Surveys have reflected this dissatisfaction but none has focused specifically on the Southwest US. The Southwest is undergoing demographic shifting, particularly in Arizona, with an increasing number of minorities, especially Latinos (4). However, this changing racial and ethnic diversity is not reflected in the Southwest physician workforce, with the vast majority remaining Caucasian, although an increasing number are now women (5).

To uncover if attitudes regarding healthcare costs differ amongst the Southwest Journal of Pulmonary and Critical Care (SWJPCC) readership, we conducted an on-line survey. The results suggest that healthcare providers agree that healthcare costs too much. Furthermore, the majority favored administrative costs/insurance expenses as the predominate contributors to the increase in costs.

Methods

Survey

An experienced survey designer (JRR) constructed a survey with the goals of determining US Southwest physician attitudes towards healthcare costs and the possible causes for the high cost. Another goal was to keep the survey brief, since previous experience was that long surveys usually have a poor response. A series of 8 questions was developed (Appendix 1).

Data Collection and Statistical Analysis

Data was collected October 9, 2019 through November 27, 2019. Most results were expressed as a percentage of the responses. There were insufficient respondents between different groups (physicians, nurses, patients, etc.) to allow statistical analysis

Results

Demographics

There were 66 respondents, of which there were 61 subspecialty physicians or residents and 5 others (2 patients,1 nurse,1 technician, and 1 other). This likely reflects the readership of a pulmonary, critical care and sleep subspecialty journal such as the SWJPCC.

Healthcare Costs Too Much in the US.

There was universal agreement (all 66 respondents responding in the affirmative) that this statement is true.

Healthcare is a Right.

Forty-three of 65 responses marked this as true (66%). Twenty-two respondents felt that this statement was false (34%) and 1 with no response.

Causes for the Increase in Healthcare Costs.

The perceived causes for the increase in healthcare costs are shown in Figure 1.

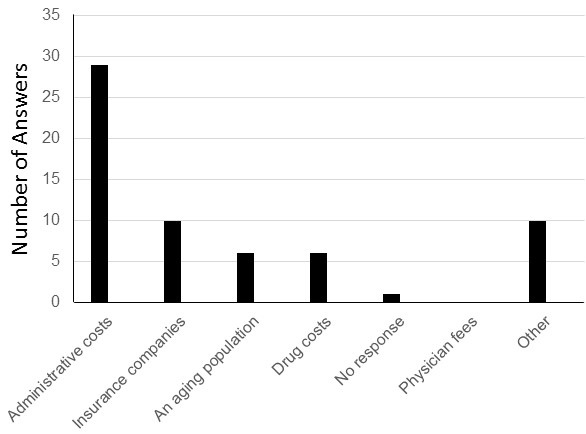
Figure 1. Respondents answers for the causes of the increase in healthcare costs.

Although the answers somewhat differed, the majority felt that administrative costs and insurance companies were important contributors to increasing healthcare costs (39 of 62, 63%). None felt that physicians’ fees contributed to the increase in healthcare costs. Other responses are given in Appendix 2.

Which Healthcare Personnel Are Over- or Underpaid. 

There were 87 answers as regards which personnel are overpaid. The healthcare personnel that were felt to be overpaid are show in Figure 2.

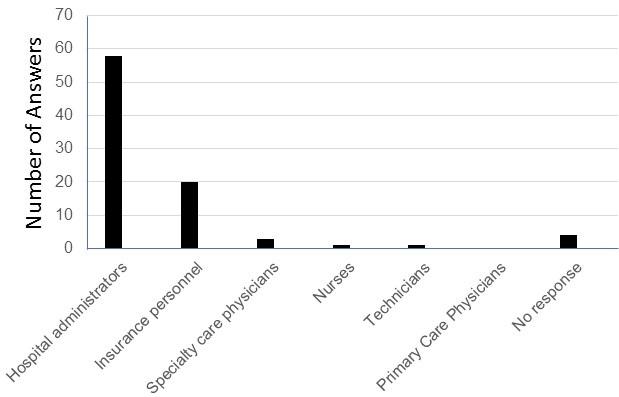
Figure 2. Respondents answers to which personnel are overpaid.

There was consensus that hospital administrators and insurance personnel were overpaid with 78 of 87 (90%) responding that they were overpaid (multiple answers could be accepted). In contrast, only 4 respondents felt specialty care physicians, and only one each, viewed nurses and technicians as being overpaid. None felt primary care physicians were overpaid.

Answers to the question “which personnel are underpaid” mirrored the answers to which healthcare personnel were overpaid (Figure 3).

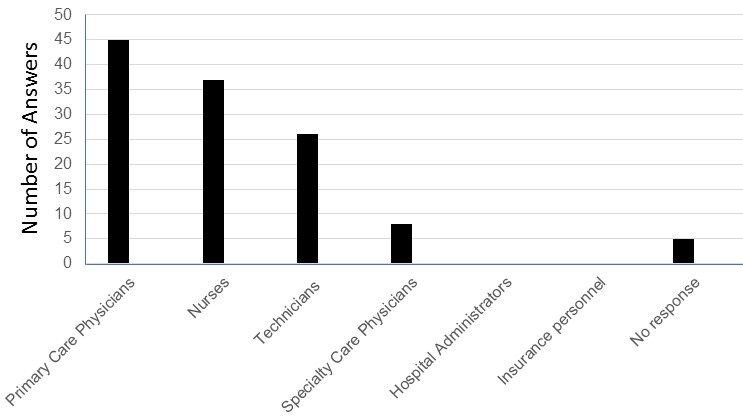
Figure 3. Respondents answers to which healthcare personnel are underpaid.

Forty-five of the 116 (39%) answers felt that primary care physicians were underpaid. A smaller number felt nurses (37 responses, 32%), technicians (26 responses, 22%), and specialty care physicians (8 responses, 7%) were underpaid. None felt that hospital administrators or insurance personnel were underpaid.

Method for Healthcare Payment

Most (65%) favored keeping private insurance but adding a public option or “Medicare for All” (15%) (Figure 4).

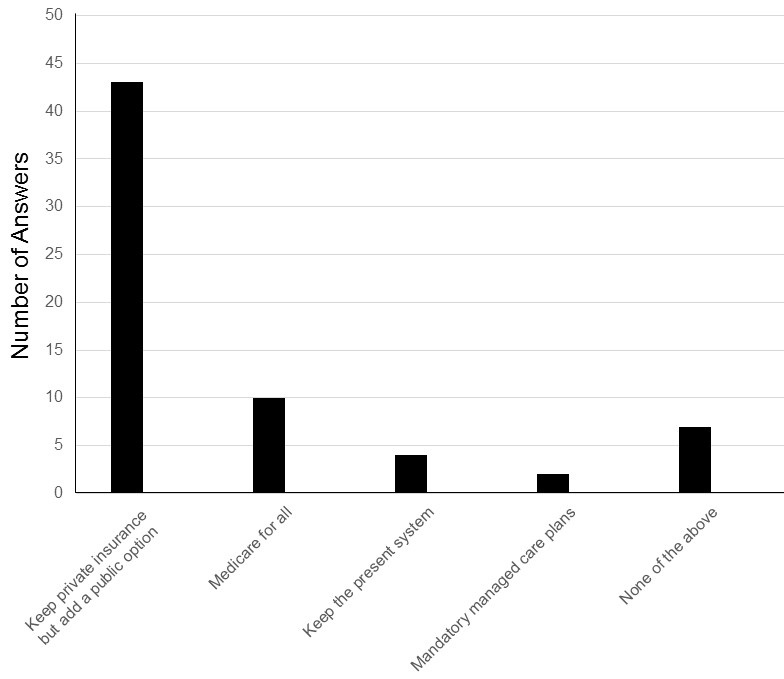
Figure 4. Responses to how to pay for healthcare.

Only 4 (6%) favored keeping the present system and only 2 (3%) favored mandatory managed care plans.

Innovations that Have Improved Quality in Healthcare

Innovations that were felt to improve healthcare are shown in Figure 5.

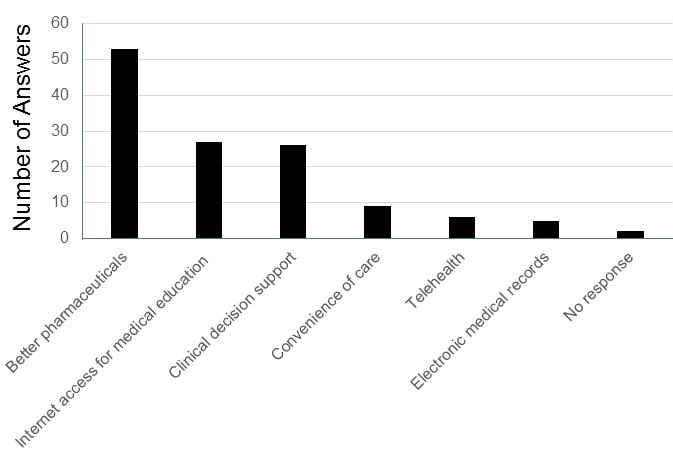
Figure 5. Innovations that have improved healthcare.

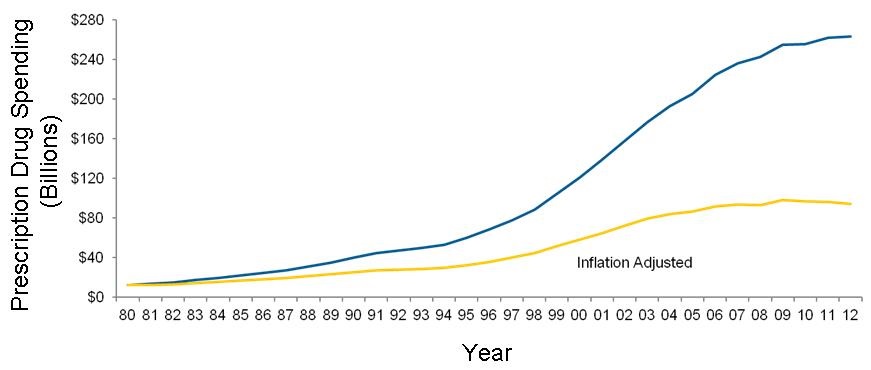
Nearly half of the 126 responses (53 responses, 42%) felt better pharmaceuticals had improved healthcare. Many also felt that internet access for medical education, such as looking up specific questions, on-line education (27 responses, 21%), and clinical decision support (26 responses, 21%) had helped. Interestingly, the most widespread innovation in healthcare in the past few years- electronic medical records- received the least support with only 5 positive responses (4%).

Discussion

This survey of readers of the Southwest Journal of Pulmonary and Critical Care strongly reflects the concern that healthcare costs too much in the US. About two-thirds of respondents felt healthcare is a right. Administrative costs and insurance companies were viewed by many as the reasons for the high costs with hospital administrators and insurance company personnel viewed as overpaid. Few viewed the electronic medical record as helpful in healthcare.

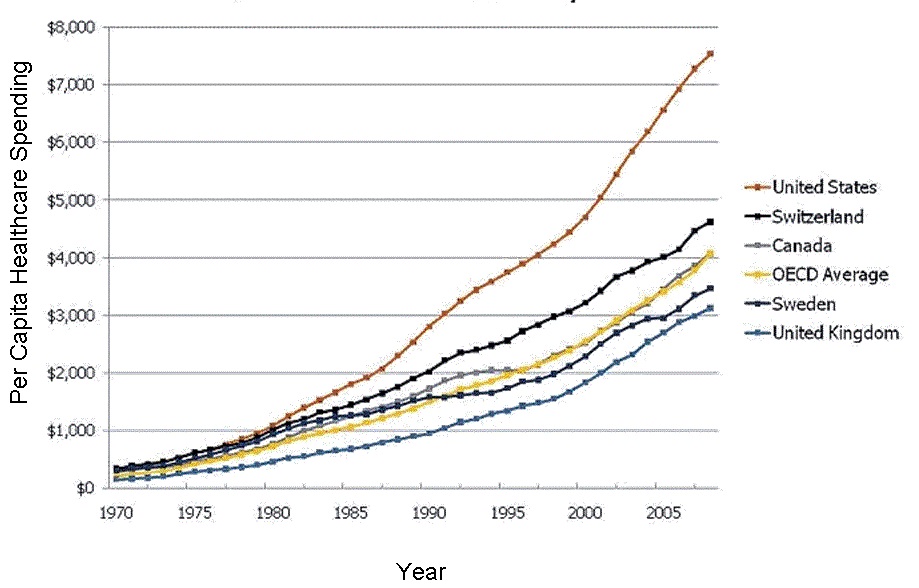
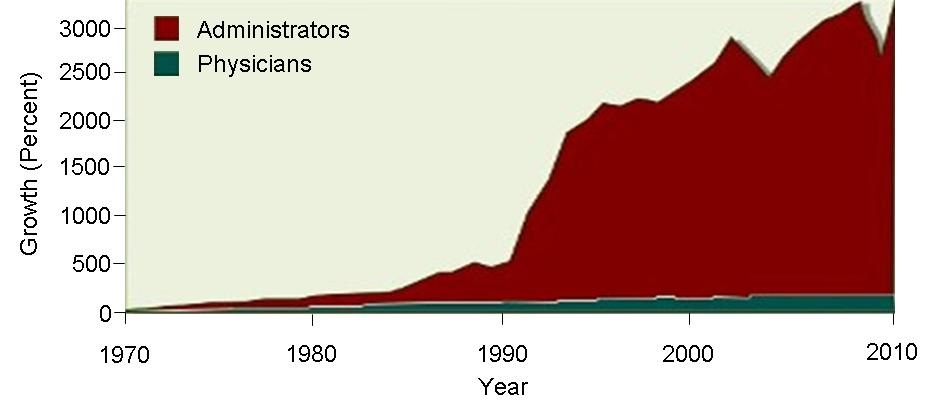
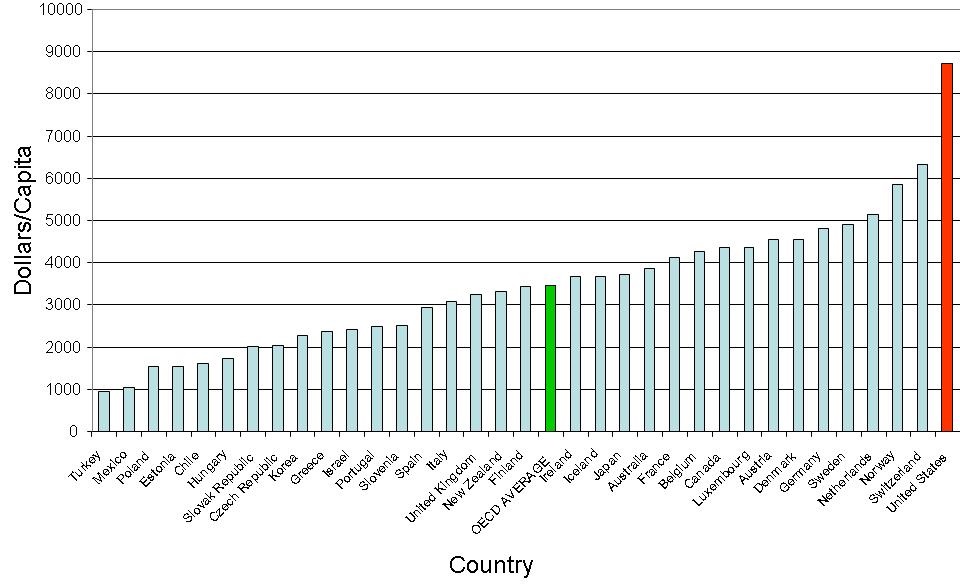
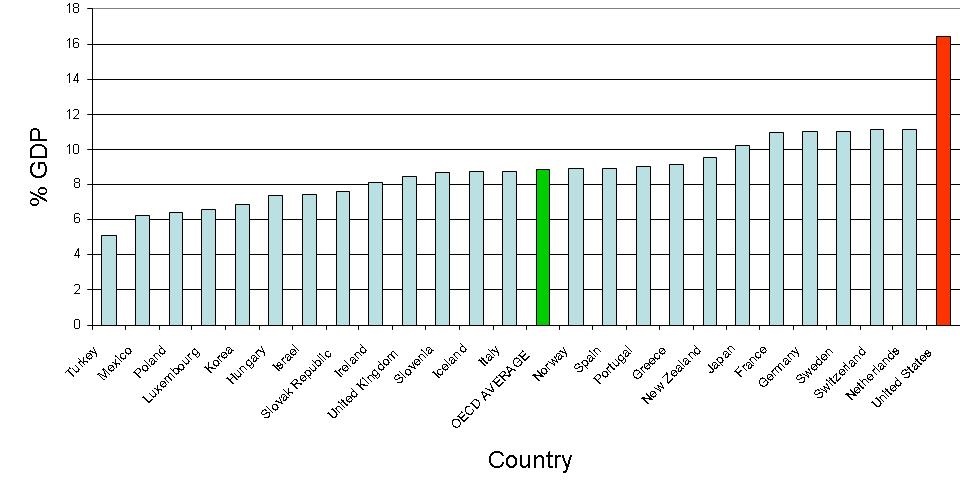
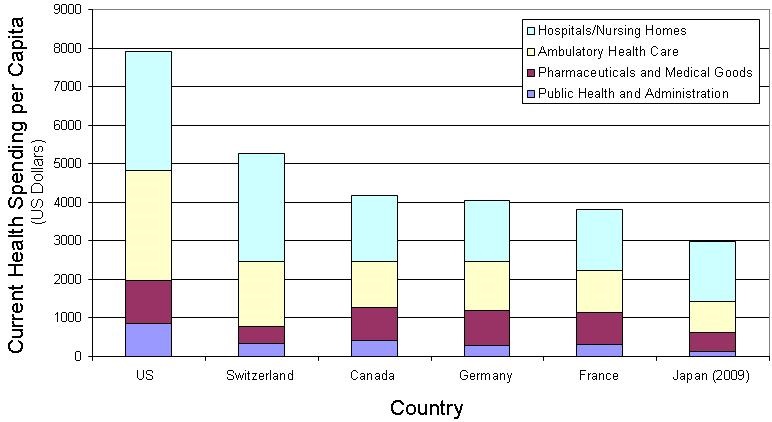
The physician opinion that healthcare costs too much is consistent with the US paying the highest cost for healthcare in the world, at over $10,000 per capita in 2017 (6). The concept that administrative costs account for much of these higher costs has only recently become widely accepted. This late realization is despite rising administrative costs highlighted by multiple articles from Woolhandler and Himmelstein, beginning with a 1991 article in the New England Journal of Medicine (7). They referred to medicine as “a spectator sport” with doctors, patients, and nurses performing before an enlarging audience of utilization reviewers, efficiency experts, and cost managers. Many physicians have watched in horror as the trend pointed out by these authors nearly 30 years ago has steadily worsened. Reports of ultrahigh CEO salaries have recently drawn some attention in both the medical and popular literature accenting the high administrative costs (8,9).

The high costs of healthcare have led to an increasing number of patients and physicians supporting a public option. Previously, physician groups, such as the American Medical Association (AMA), have thwarted public health insurance proposals since the 1930s. However, as the next generation of physicians takes on leadership roles, even groups such as the AMA are now reexamining this question (10). A March 2018 New England Journal of Medicine survey found 61 percent of 607 respondents said single-payer would make it easier to deliver cost-effective, quality health care (11). This is similar to the 80% of our readership favoring a public option. However, in our survey, most (65%) favored keeping private insurance in addition to the public option. This likely represents a physician reaction to increasing regulatory burdens by the Centers for Medicare and Medicaid Services and the Department Veterans of Affairs, two US government agencies involved in healthcare. 

Despite the changing population demographics in the Southwest US, physicians still tend to be Caucasian, although more are now women (4,5). Our data suggests that support for a public option is high among physicians. We did not ask our readers their age, although younger physicians preferentially seem to be more likely to support a public option (10). Furthermore, most pulmonary physicians are now Democrats who tend to support a public option (12). We also did not ask where the physicians practice, although it seems likely most are in the Southwest US.

Our data are consistent with other surveys, although the Southwest US and the Southern US are often viewed as the home of US conservatism. However, even though most favored a public option in our survey, there seems to be sufficient distrust of “big government” to limit the choice to only a public option (13).

References

  1. Jones JM, Reinhart RJ. Americans remain dissatisfied with healthcare costs. Gallup Poll. Nov 28, 2018. Available at: https://news.gallup.com/poll/245054/americans-remain-dissatisfied-healthcare-costs.aspx (accessed 12/17/19).
  2. Saad L. Four in 10 in U.S. dissatisfied with their healthcare costs. Gallup Poll. Dec 12, 2016. Available at: https://news.gallup.com/poll/199298/four-dissatisfied-healthcare-costs.aspx (accessed 12/17/19).
  3. Friedberg MW, Chen PG, Van Busum KR, et al. Factors affecting physician professional satisfaction and their implications for patient care, health systems, and health policy. Rand Health Q. 2014 Dec 1;3(4):1. eCollection 2014 Winter.
  4. Cárdenas V, Kerby S, Wilf R. Arizona’s demographic changes. Center for American Progress. 2012. Available at: https://www.americanprogress.org/issues/poverty/news/2012/02/28/11060/arizonas-demographic-changes/ (Accessed 12/17/19).
  5. Xierali IM, Nivet MA. The racial and ethnic composition and distribution of primary care physicians. J Healthcare Poor Underserved. 2018;29(1):556-70.     [CrossRef] [PubMed]
  6. Sawyer B, Cox C. How does health spending in the U.S. compare to other countries? Peterson KFF Health System Tracker. December 7, 2018. Available at: https://www.healthsystemtracker.org/chart-collection/health-spending-u-s-compare-countries/#item-start (accessed 12/17/19).
  7. Woolhandler S, Himmelstein DU. The deteriorating administrative efficiency of the US healthcare system. N Engl J Med. 1991;324(18):1253-8. [CrossRef] [PubMed]
  8. Robbins RA. CEO compensation-one reason healthcare costs so much. Southwest J Pulm Crit Care. 2019;19(2):76-8. [CrossRef]
  9. Andrzejewski A.  Top U.S. "Non-Profit" hospitals & CEOs are racking up huge profits. Jun 26, 2019. Available at: https://www.forbes.com/sites/adamandrzejewski/2019/06/26/top-u-s-non-profit-hospitals-ceos-are-racking-up-huge-profits/#48c7a4d119df (accessed 12/17/19).
  10. Luthra S. Once its greatest foes, doctors are embracing single-payer. Kaiser Health News. August 7, 2018. Available at: https://khn.org/news/once-its-greatest-foes-doctors-are-embracing-single-payer/ (accessed 12/17/19).
  11. Serafini M. Why clinicians support single-payer-and who will win and lose. NEJM Catalyst. January 17, 2018. Available at: https://catalyst.nejm.org/doi/full/10.1056/CAT.18.0278 (accessed 12/17/19).
  12. Frellick M. Physician specialties correlate with political affiliation. Medscape. October 12, 2016. Available at: https://www.medscape.com/viewarticle/870192 (accessed 12/17/19).
  13. Robbins RA, Wang AC. Medicare for all-good idea or political death? Southwest J Pulm Crit Care. 2019;19(1):18-20. [CrossRef]

Cite as: Robbins RA, Gotway MB, Robbins JR, Wesselius LJ. Results of the SWJPCC healthcare survey. Southwest J Pulm Crit Care. 2020;20(1):9-15. doi: https://doi.org/10.13175/swjpcc074-19 PDF 

Tuesday
Jan172017

Is Quality of Healthcare Improving in the US?

Richard A. Robbins, MD

Phoenix Pulmonary and Critical Care Research and Education Foundation

Gilbert, AZ USA


Abstract

Politicians and healthcare administrators have touted that under their leadership enormous strides have been made in the quality of healthcare. However, the question of how to measure quality remains ambiguous. To demonstrate improved quality that is meaningful to patients, outcomes such as life expectancy, mortality, and patient satisfaction must be validly and reliably measured. Dramatic improvements made in many of these patient outcomes through the twentieth century have not been sustained through the twenty-first. Most studies have shown no, or only modest improvements in the past several years, and at a considerable increase in cost. These data suggest that the rate of healthcare improvement is slowing and that many of the quality improvements touted have not been associated with improved outcomes.

Surrogate Markers

The most common measures of quality of healthcare come from Donabedian in 1966 (1). He identified two major foci for the measuring quality of care-outcome and process. Outcome referred to the condition of the patient and the effectiveness of healthcare including traditional outcome measures such as morbidity, mortality, length of stay, readmission, etc. Process of care represented an alternative approach which examined the process of care itself rather than its outcomes.

Beginning in the 1970’s the Joint Commission began to address healthcare quality by requiring hospitals to perform medical audits. However, the Joint Commission soon realized that the audit was “tedious, costly and nonproductive” (2). Efforts to meet audit requirements were too frequently “a matter of paper compliance, with heavy emphasis on data collection and few results that can be used for follow-up activities. In the shuffle of paperwork, hospitals often lost sight of the purpose of the evaluation study and, most important, whether change or improvement occurred as a result of audit”. Furthermore, survey findings and research indicated that audits had not resulted in improved patient care and clinical performance (2).

In response to the ineffectiveness of the audit and the call to improve healthcare, the Joint Commission introduced new quality assurance standards in 1980 which emphasized measurable improvement in process of care rather than outcomes. This approach proved popular with both regulatory agencies and healthcare investigators since it was easier and quicker to show improvement in process of care surrogate markers than outcomes.

Although there are many examples of the misapplication of these surrogate markers, one recent example of note is ventilator-associated pneumonia (VAP), a diagnosis without a clear definition. VAP guidelines issued by the Institute for Healthcare Improvement include elevation of the head of the bed, daily sedation vacation, daily readiness to wean or extubate, daily spontaneous breathing trial, peptic ulcer disease prophylaxis, and deep venous thrombosis prophylaxis. As early as 2011, the evidence basis of these guidelines was questioned (3). Furthermore, compliance with the guidelines had no influence on the incidence of VAP or inpatient mortality (3). Nevertheless, relying on self-reported hospital data the CDC published data touting declines in VAP rates of 71% and 62% in medical and surgical intensive care units, respectively, between 2006 and 2012 (4,5). However, Metersky and colleagues (6) reviewed Medicare Patient Safety Monitoring System (MPSMS) data on 86,000 critically ill patients between 2005 and 2013 and report that VAP rates remain unchanged since 2005.

Hospital Value-Based Purchasing (HVBP)

CMS’ own data might be interpreted as showing no improvement in quality. About 200 fewer hospitals will see bonuses from the Centers for Medicare and Medicaid Services (CMS) under the hospital value-based purchasing (HVBP) program in 2017 than last year (7). The program affects some 3,000 hospitals and compares hospitals to other hospitals and its own performance over time.

The reduction in payments are “somewhat concerning,” according to Francois de Brantes, executive director of the Health Care Incentives Improvement Institute (7). One reason given was fewer hospitals were being rewarded, but another was hospitals' lack of movement in rankings. The HVBP contains inherent design flaws according to de Brantes. As a "tournament-style" program in which hospitals are stacked up against each other, they don't know how they'll perform until the very end of the tournament. "It's not as if you have a specific target," he said. "You could meet that target, but if everyone meets that target, you're still in the middle of the pack."

Although de Brantes point is well taken, another explanation might be that HVBP might reflect a declining performance in healthcare. If the HVBP program is to reward quality of care, fewer hospitals being rewarded logically indicates poorer care. As noted above, CMS will likely be quick to point out that they have established an ever-increasing litany of "quality" measures self-reported by the hospitals that show increasing compliance with these measures (8). However, the lack of improvement in patient outcomes (see below) suggests that completion of these has little meaningful effect.

Life Expectancy

Although life expectancy for the Medicare age group is improving, the increase likely reflects a long-term improvement in life expectancy and may be slowing over the past few years (Figure 1) (9). Since 2005, life expectancy at birth in the U.S. has increased by only 1 year (10).

Figure 1. Life expectancy past age 65 by year.

The reason(s) for the declining improvement in life expectancy in the twenty-first century compared to the dramatic improvements in the twentieth are unclear but likely multifactorial. However, one possible contributing factor to a slowing improvement in mortality is a declining or flattening rate of improvement in healthcare.

Inpatient Mortality

Figueroa et al. (11) examined the association between HVBP and patient mortality in 2,430,618 patients admitted to US hospitals from 2008 through 2013. Main outcome measures were 30-day risk adjusted mortality for acute myocardial infarction, heart failure, and pneumonia using a patient level linear spline analysis to examine the association between the introduction of the HVBP program and 30-day mortality. Non-incentivized, medical conditions were the comparators. The difference in the mortality trends between the two groups was small and non-significant (difference in difference in trends −0.03% point difference for each quarter, 95% confidence interval −0.08% to 0.13%-point difference, p=0.35). In no subgroups of hospitals was HVBP associated with better outcomes, including poor performers at baseline.

Consistent with Figueroa’s data, inpatient mortality trends declined only modestly from 2000 to 2010 (Figure 2) (12).

Figure 2. Number of inpatient deaths 2000-10.

Although the decline was significant, the significance appears to be mostly explained by a greater that expected drop in 2010 and may not represent a real ongoing decrease. Consistent with the modest improvements seen in overall inpatient mortality, disease-specific mortality rates for stroke, acute myocardial infarction (AMI), pneumonia and congestive heart failure (CHF) all declined from 2002-12. However, the trend appears to have slowed since 2007 especially for CHF and pneumonia (Figure 3).

Figure 3. Inpatient mortality rates for stroke, acute myocardial infarction (AMI), pneumonia and congestive heart failure (CHF) 2002-12.

Consistent with the trend of slowing improvement, mortality rates for these four conditions declined at −0.13% for each quarter during from 2008 until Q2 2011 but only −0.03% from Q3 2011 until the end of 2013 (12).

Patient Ratings of Healthcare

CMS has embraced the concept of patient satisfaction as a quality measure, even going so far as rating hospitals based on patient satisfaction (13). The Gallup company conducts an annual poll of Americans' ratings of their healthcare (14). In general, these have not improved and may have actually declined in the past 2 years (Figure 4).

Figure 4. Americans’ rating of their healthcare.

Cost

There is little doubt that healthcare costs have risen (15). The rising cost of healthcare has been cited as a major factor in Americans’ poor rating of their healthcare. The trend appears to be one of increasing dissatisfaction with the cost of healthcare (Figure 5) (16).

Figure 5. Americans’ satisfaction or dissatisfaction with the cost of healthcare.

Discussion

Americans have enjoyed remarkable improvements in life expectancy, mortality, and satisfaction with their healthcare over the past 100 years. However, the rate of these improvements appears to have slowed despite an ever-escalating cost. Starting with a much lower life expectancy in the US, primarily due to infections disease, the dramatic effect of antibiotics and vaccines on overall mortality in the twentieth century would be difficult to duplicate. The current primary causes of mortality in the US, heart disease and cancer, are perhaps more difficult to impact in the same way. However, declining healthcare quality may explain, at least in part, the slowing improvement in healthcare.

The evidence of lack, or only modest, improvement in patient outcomes is part of a disturbing trend in quality improvement programs by healthcare regulatory agencies. Under political pressure to “improve” healthcare, these agencies have  imposed weak or non-evidence based guidelines for many common medical disorders. In the case of CMS, hospitals are required to show compliance improvement under the threat of financial penalties. Not surprisingly, hospitals show an improvement in compliance whether achieved or not (17). The regulatory agency then extrapolates this data from previous observational studies to show a decline in mortality, cost or other outcomes. However, actual measure of the outcomes is rarely performed. This difference is important because a reduction in a surrogate marker may not be associated with improved outcomes, or worse, the improvement may be fictitious. For example, many patients often die with a hospital-acquired infection. Certainly, hospital-acquired infections are associated with increased mortality. However, preventing the infections does not necessarily prevent death. For example, in patients with widely metastatic cancer, infection is a common cause of death. However, preventing or treating the infection, may do little other than delay the inevitable. A program to improve infections in these patients would likely have little effect on any meaningful patient outcomes.

There is also a trend of bundling weakly evidence-based, non-patient centered surrogate markers with legitimate performance measures (18). Under threat of financial penalties, hospitals are required to improve these surrogate markers, and not surprisingly their reports indicate they do. The organization mandating compliance with their outcomes reports that under their guidance hospitals have significantly improved healthcare saving both lives and money. However, if the outcome is meaningless or the hospital lies about their improvement, there is no overall quality improvement. There is little incentive for the parties to question the validity of the data. The organization that mandates the program would be politically embarrassed by an ineffective program and the hospital would be financially penalized for honest reporting.

Improvement begins with the establishment of measures that are truly evidence-based. Surrogate markers should only be used when improvement in that marker has been unequivocally shown to improve patient-centered outcomes. The validity of the data also needs to be independently confirmed. Those regulatory agency-demanded quality improvement programs that do not meet these criteria need to be regarded for what they are-political propaganda rather than real solutions.

The above data suggest that healthcare is improving little in what matters most, patient-centered outcomes. Those claims by regulatory agencies of improved healthcare should be regarded with skepticism unless corroborated by improvement in valid patient-centered outcomes.

References

  1. Donabedian A. Evaluating the quality of medical care. 1966. Milbank Q. 2005;83(4):691-729. [PubMed]
  2. Affeldt JE. The new quality assurance standard of the Joint Commission on Accreditation of Hospitals. West J Med. 1980;132:166-70. [PubMed]
  3. Padrnos L, Bui T, Pattee JJ, et al. Analysis of overall level of evidence behind the Institute of Healthcare Improvement ventilator-associated pneumonia guidelines. Southwest J Pulm Crit Care 2011;3:40-8.
  4. Edwards JR, Peterson KD, Andrus ML, et al; NHSN Facilities. National Healthcare Safety Network (NHSN) Report, data summary for 2006, issued June 2007. Am J Infect Control. 2007;35(5):290-301. [CrossRef] [PubMed]
  5. Dudeck MA, Weiner LM, Allen-Bridson K, et al. National Healthcare Safety Network (NHSN) report, data summary for 2012, device-associated module. Am J Infect Control. 2013;41(12):1148-66. [CrossRef] [PubMed]
  6. Metersky ML, Wang Y, Klompas M, Eckenrode S, Bakullari A, Eldridge N. Trend in ventilator-associated pneumonia rates between 2005 and 2013. JAMA. 2016 Dec 13;316(22):2427-9. [CrossRef] [PubMed]
  7. Whitman E. Fewer hospitals earn Medicare bonuses under value-based purchasing. Medscape. November 1, 2016. Available at: http://www.modernhealthcare.com/article/20161101/NEWS/161109986 (accessed 11/3/16).
  8. Centers for Medicare & Medicaid Services. 2015 national impact assessment of the centers for medicare & medicaid services (CMS). quality measures report. March 2, 2015. Available at: https://www.cms.gov/medicare/quality-initiatives-patient-assessment-instruments/qualitymeasures/downloads/2015-national-impact-assessment-report.pdf (accessed 11/3/16).
  9. National Center for Health Statistics. Health, United States, 2015: With Special Feature on Racial and Ethnic Health Disparities. Hyattsville, MD. 2016. Available at: http://www.cdc.gov/nchs/data/hus/hus15.pdf#015 (accessed 11/3/16).
  10. Johnson NB, Hayes LD, Brown K, Hoo EC, Ethier KA. CDC National health report: leading causes of morbidity and mortality and associated behavioral risk and protective factors—United States, 2005–2013October 31, 2014/ 63(04);3-27. Available at: https://www.cdc.gov/mmwr/preview/mmwrhtml/su6304a2.htm (accessed 11/3/16).
  11. Figueroa JF, Tsugawa Y, Zheng J, Orav EJ, Jha AK. Association between the Value-Based Purchasing pay for performance program and patient mortality in US hospitals: observational study. BMJ. 2016 May 9;353:i2214.
  12. Centers for Disease Control. Trends in inpatient hospital deaths: national hospital discharge survey, 2000–2010. March 2013. Available at: http://www.cdc.gov/nchs/products/databriefs/db118.htm (accessed 11/3/16).
  13. CMS. First release of the overall hospital quality star rating on hospital compare. July 27, 2016. Available at: https://www.cms.gov/Newsroom/MediaReleaseDatabase/Fact-sheets/2016-Fact-sheets-items/2016-07-27.html (accessed 11/3/16)
  14. Newport F. Ratings of U.S. healthcare quality no better after ACA. November 19, 2015. Available at: http://www.gallup.com/poll/186740/americans-own-healthcare-ratings-little-changed-aca.aspx (accessed 11/3/16).
  15. Robbins RA. National health expenditures: the past, present, future and solutions. Southwest J Pulm Crit Care. 2015;11(4):176-85.
  16. Newport F. Ratings of U.S. healthcare quality no better after ACA. November 19, 2015. Available at: http://www.gallup.com/poll/186740/americans-own-healthcare-ratings-little-changed-aca.aspx (accessed 11/3/16).
  17. Meddings JA, Reichert H, Rogers MA, Saint S, Stephansky J, McMahon LF. Effect of nonpayment for hospital-acquired, catheter-associated urinary tract infection: a statewide analysis. Ann Intern Med 2012;157:305-12. [CrossRef] [PubMed]
  18. CMS. Bundled payments for care improvement (BPCI) initiative: general information. November 28, 2016. Available at:  https://innovation.cms.gov/initiatives/bundled-payments/ (accessed 12/30/16).

Cite as: Robbins RA. Is quality of healthcare improving in the US? Southwest J Pulm Crit Care. 2017;14(1):29-36. doi: https://doi.org/10.13175/swjpcc110-16 PDF 

Monday
Oct192015

National Health Expenditures: The Past, Present, Future and Solutions

Richard A. Robbins, MD

Phoenix Pulmonary and Critical Care Research and Education Foundation

Gilbert, AZ

"[T]he US health care system … defies the laws of economics, and of gravity. Once the price is high, it just stays there."- Dr. Naoki Ikegami

Abstract

The costs of health care in the US have been increasing for many years and the US now spends more on health care than other developed country. The cost of health care is higher in the US in nearly every category. However, the dramatic rise in health care costs over the past 35 years occurs during the time when pharmaceutical costs and administrative costs have also dramatically risen. It seems likely that these costs may account for much of the increase in health care. However, neither is dealt with by the Affordable Care Act (ACA). Until a system of oversight is enacted on medical costs, it seems likely that US health care costs will continue to rise.

The Past

In comparison to other economically developed countries health care costs have risen dramatically in the US over the past 35 years (Figure 1) (1).

Figure 1. Rise in health care spending in the US and selected other countries.

Myths. The reasons for this rise in spending have been shrouded in myths and accusations. It has been argued that high costs is the price for the best health-care system in the world. However, patient outcomes in the US are mixed. In a 2011 report by the Organization for Economic Co-operation and Development (OECD), the United States ranked 25th in life expectancy (1). Although we do better in cancer survival rates, we are more likely to die of heart disease and we do not have a good track record on treating chronic diseases such as asthma.

Health care rationing. An argument has been made that because health care is heavily rationed in other countries, Americans use more health-care services in comparison. We do rank high in the use of some expensive tests and procedures (more on this later), but overall the OECD reports that the US is well below other developed countries in number of average doctor visits per year, hospitalizations and hospital length of stay (1). Americans have better-than-average access to specialists, but we lag compared to other countries in getting immediate access to a primary care doctor when we're sick and we are much more likely forgo heath care because of costs (2).

Bad patients. Some have claimed that the US has to spend more on health care because we are fat and lazy. Although this may be true, it does not explain the gap in health care spending between the US and other countries. Obesity rates are higher in the US but the US compares well to other countries in smoking and drinking (1). We also have a younger population compared to many other OECD countries which should actually lower costs (1).

Tort reform. The US has more lawyers and more lawsuits of doctors but this does not seem to be a major factor in health care costs. Tort reform would probably not go far in bringing down US health-care costs. A 2009 study by the nonpartisan Congressional Budget Office (CBO) found that implementing tort reform would reduce US health care spending by only 2 percent (3).

Government inefficiency. There is also speculation that US Government inefficiency and spending that drives up health care costs. Health care administrative costs in the Veterans Administration (VA) are estimated to be lower than private insurance according to the CBO (4). However, as recently discovered in the patient wait times scandal, VA data may be suspect. The Centers for Medicare and Medicaid Service's (CMS) administrative costs are reported to be about 2 percent of claims costs, while private insurance companies’ administrative costs are in the 20 to 25 percent range. The argument is that private industry with costs for advertising, collection, and profit are eliminated by CMS resulting in lower costs. However, this concept has also been challenged. CMS’s administrative costs are often hidden or completely ignored by the complex and bureaucratic reporting and tracking systems used by CMS (5). Furthermore, the estimates completely ignore the inefficiencies created by CMS's mandates requiring an increasingly heavy paperwork burden for physicians and hospitals.

Physician income. Some think that greedy physicians making too much money explain the rising costs in health care. Physician compensation varies widely between specialty, health care setting and region. Laugesen and Glied (6) concluded that higher physician fees were the main drivers of higher US spending. However, in 1970, the average inflation-adjusted income of general practitioners was $185,000. In 2010, it was $161,000, despite a near doubling of the number of patients that doctors see a day. Furthermore, during the boom years of the 1990's physician incomes remained relatively stagnant with an actual decline in the early 2000's (7-9). Although physician income is higher in the US than other countries, it would not appear to explain increasing health care costs since physician income was predominately stagnant or decreasing while health care costs rose.

Drug costs. Pharmaceutical costs have been increasing in the US (Figure 2) (10).


Figure 2. Total prescription drug spending 1980-2012.

Some have blamed these costs in increasing health care costs in the US. Although the rate of growth appears to be leveling off when adjusted for inflation (Figure 2), pharmaceutical costs remain high in the US.

Administrative costs. In ground-breaking work published in 1991 Woolhandler and Himmelstein (11) found that US administrative health care costs increased 37% between 1983 and 1987. They estimated these costs accounted for nearly a quarter of all health care expenditures. In Canada the administrative costs were about half as much and declined over the same period. They followed their 83-87 report by examining data from 1999 (12). US administrative costs had risen to 31% of US health care expenditures.

The trend is perhaps best illustrated by the graph below (Figure 3) (13).  

Figure 3. Growth in administrators and physicians 1970-2010 (used with permission of David Himmelstein).

The growth in administrative costs may not limited to the private sector. CMS' administrative costs are very difficult to determine. Similarly, the VA also has hidden costs. However, during my 30 years at the VA, I saw a disturbing growth in the front office. New assistant directors were continually hired, sometimes during a hiring freeze when needed doctors and nurses were not hired (Robbins RA, unpublished observations). The growth in VA administration has been staggering at some levels. Regional Veterans Integrated Service Network (VISN) offices were founded in the mid 1990's. However, these VISNs provide no healthcare and now number nearly 5000 employees (14). VA central office in Washington grew from about 800 employees to 11,000 in the last 15 years (14). This represents a staggering 20-fold increase over the past 15 years.

The Present

High Costs. Nearly everyone agrees that health care costs are too high and have continued to rise albeit more slowly during the Obama administration (1,15). At $8713 per person the US outspent every other OECD country for a number of years including 2015 (Figure 4) (1,15).

Figure 4. Current expenditure on health, per capita, US$ purchasing power parities. OECD average in green and United States in red.

The next closest was Switzerland at $6325. The US is a very rich country, but even so, it has devoted an increasing percentage of its gross domestic product (GDP) to health than any other country for a number of years including 2015 (Figure 5).

Figure 5. Current expenditure on health as a % of gross domestic product (GDP). OECD average in green and United States in red.

Switzerland is the next highest, at 11.1% of GDP, and the average among economically developed countries was almost half that of the US, at 8.9%.

High Numbers of Expensive Procedures. There is plenty of blame to spread for the increased cost of health care in the US. Spending on almost every area of health care is higher (Figure 6) (1,2).

Figure 6. Health spending by category in US dollars 2010 or latest year available.    

Because the spending is higher in nearly every category, the reasons for the high costs in the US are likely multifactorial. US health care has a long-standing reputation for excessive numbers of procedures at high costs. The data would seem to back that impression. The numbers of some expensive procedures or operations appear to be higher in the US compared to other countries (Table 1) (1).

Table 1. Numbers of exams or procedures in the US with OECD rank and average.

High Cost per Procedure. Furthermore, the costs of procedures in the US are high compared to other countries (1,16). (Table 2).

Table 2. Cost of common procedures. Highest cost in red.

The average price for a wide range of both medical and surgical services in the US is 85 percent higher than other OECD countries (16). Both the numbers of expensive procedures and the high cost of procedures undoubtedly contribute to the high cost of health care in the US.

Administrative Costs. In 1999 the administrative costs of health care were estimated to be about 1/3 of all costs and were rapidly rising. There appears to have been little slow down in the rapid rise of administrative costs. Himmelstein and Woolhandler (17) estimated that administration costs could be as much as 45% of health care costs in 2014. There is no line for administrative costs on a medical bill but these costs are factored into all categories of medical spending.

The Future

As both Niels Bohr and Yogi Berra have said, "it's tough to make predictions, especially about the future". Now that King vs. Burwell has been settled, it is apparent that American health care will be directed by the ACA for the foreseeable future. Each year an official National Health Expenditure Projections for the next 10 years is released by the Centers for Medicare and Medicaid Services (CMS)’ Office of the Actuary. By examining these projections (which may be overly optimistic) as well as some observational studies, a rough prediction for the costs of health care can be made.

Economies of Scale. A principle in medical economics central to the Affordable Care Act (ACA) is economies of scale (18). The theory is that larger insurers will have lower prices because they are more administratively efficient. However, a recent study found that the largest insurer in each of the US states served by HealthCare.gov raised their prices in 2015 by an average of over 10% compared to smaller competitors in the same market (19). Those steeper price hikes for monthly premiums did not seem warranted by the level of health claims which did not significantly differ as a percentage of premiums in 2014.

Provider-Owned Health Plans. Another principle of the ACA in controlling health care costs is establishment of provider-owned (usually hospital) health plans. The theory is that substitution of provider-owned health plans will lower costs by controlling doctors over charging in a fee-for-service model. Although temptingly simple, a recent study concludes that this theory is not supported by the evidence. Comparing provider-owned to nonprovider-owned plans within twelve counties across the US was on average 12% more expensive compared to traditional insurers (20).

Drug Costs. Although drug prices remain consistently high in the US compared to other economically developed countries, competition to reduce these prices for CMS patients has been limited by Congress. Most health care plans have focused on formularies to control prices. Under this system, contracts with pharmaceutical manufacturers establish preferred drugs for use by their clients and their contracted physician prescribers. Although this strategy has been in place for some time, it appears to be ineffectual in controlling drug costs (Figure 6). Most countries place price controls on drugs, a strategy that seems to lack political will in the US (21). There appears to be little in the ACA that will control drug costs.

Administrative Costs. Himmelstein and Woolhandler (22) calculated new overhead costs from the official National Health Expenditure Projections for 2012-2022 released by the Centers for Medicare and Medicaid Services (CMS)’ Office of the Actuary in July 2014. Between 2014 and 2022, CMS projects $2.757 trillion in spending for private insurance overhead and administering government health programs (mostly Medicare and Medicaid), including $273.6 billion in new administrative costs attributable to the ACA. Nearly two-thirds of this new overhead—$172.2 billion—will go for increased private insurance overhead.

Most of this soaring private insurance overhead is attributable to rising enrollment in private plans which carry high costs for administration and profits. The rest reflects the costs of running the ACA exchanges.

Insuring the 25 million additional Americans, as the ACA is projected to do, is surely worthwhile, but the administrative cost is enormous. The ACA isn’t the first time we’ve seen bloated administrative costs from a federal program that subcontracts for coverage through private insurers. Medicare Advantage plans’ overhead averaged 13.7 percent in 2011, about $1,355 per enrollee. However, both Congress and the White House seem intent on sending more federal dollars to private insurers. Indeed, the House Republican’s initial budget proposal would have "voucherized" Medicare, eventually diverting almost the entire Medicare budget to private insurers. Fortunately, the measure passed by the House on April 30, 2015 dropped the voucher scheme.

Solutions

The difficulty with the ACA is that it does not appear to control the two major causes of the rise in health care spending - pharmaceutical costs and more importantly administrative costs. Himmelstein and Woolhandler (22) have long advocated a national single-payer system for health care similar to Canada's. They cite the low overhead for Medicare and Medicaid and the VA as demonstrating that such a system can work in the US. Despite the obfuscation of the overhead data by both US government agencies such as CMS and the VA, it seems likely that a single payer system would be more efficient than a private system. As Himmelstein and Woolhandler (22) have stated "public insurance gives much more bang for each buck".

However, a caveat must be added. A lesson that should be learned from the recent VA scandal is that public officials are no more honest that private companies in reporting data. Any system devised will need close oversight by knowledgeable patient care advocates. If not, the dollars intended for health care will be diverted into administrative pockets. It seems most likely that this should be on a local level by health care providers not employed or appointed by the administrators they oversee. Otherwise, there would be no real oversight. The ACA seems to encourage "provider-owned" health plans. These plans should be overseen not by the business cronies or administratively appointed physicians and nurses, but by independent health care providers who will look at administrative costs with a suspicious eye and question the costs at a local level. Otherwise the present system of less care at higher prices will persist.

References

  1. Organisation for Economic Co-operation and Development. Available at: http://www.oecd.org/ (accessed 8/4/15).
  2. Stokes B. Health affairs: among 11 nations, American seniors struggle more with health costs. Pew Research Center. December 3, 2014. Available at: http://www.pewresearch.org/fact-tank/2014/12/03/health-affairs-among-11-nations-american-seniors-struggle-more-with-health-costs/ (accessed 8/4/15).
  3. Congressional Budget Office. October 9, 2009. Available at: https://www.cbo.gov/sites/default/files/111th-congress-2009-2010/reports/10-09-tort_reform.pdf (accessed 8/4/15).
  4. Congressional Budget Office. Comparing the costs of the veterans’ health care system with private-sector costs. December, 2014. Available at: https://www.cbo.gov/sites/default/files/cbofiles/attachments/49763-VA_Health care_Costs.pdf (accessed 8/4/15).
  5. Mathews M. Medicare’s hidden administrative costs: a comparison of Medicare and the private sector. The Council for Affordable Health Insurance. January 10, 2006. Available at: http://www.cahi.org/cahi_contents/resources/pdf/CAHI_Medicare_Admin_Final_Publication.pdf (accessed 8/4/15).
  6. Laugesen MJ, Glied SA. Higher fees paid to US physicians drive higher spending for physician services compared to other countries. Health Aff (Millwood). 2011;30(9):1647-56. [CrossRef] [PubMed]
  7. Ballas C. Why do doctors accept gifts, and what would happen if they didn't? The Last Psychiatrist. October 26, 2010. Available at: http://thelastpsychiatrist.com/2010/10/why_do_doctors_accept_gifts.html (accessed 8/4/15).
  8. Tu HT, Ginsburg PB. Losing ground: physician income, 1995-2003. Track Rep. 2006;(15):1-8. [PubMed]
  9. Medscape physician compensation report 2015. Available at: http://www.medscape.com/features/slideshow/compensation/2015/public/overview#page=1 (accessed 8/4/15).
  10. Centers for Medicare & Medicaid Services, Office of the Actuary. Data released January 7, 2014. Available at: https://www.cms.gov/Research-Statistics-Data-and-Systems/Statistics-Trends-and-Reports/NationalHealthExpendData/Downloads/Proj2012.pdf (accessed 8/4/15)
  11. Woolhandler S, Himmelstein DU. The deteriorating administrative efficiency of the US health care system. N Engl J Med. 1991;324(18):1253-8. [CrossRef] [PubMed]
  12. Woolhandler S, Campbell T, Himmelstein DU. Costs of health care administration in the United States and Canada. N Engl J Med. 2003;349(8):768-75. [CrossRef] [PubMed]
  13. Bureau of Labor Statistics. NCHS. Himmelstein and Woolhandler analysis of current population survey. Avaialable at: http://www.pnhp.org/ (accessed 8/4/15).
  14. Kizer KW, Jha AK. Restoring trust in VA health care. N Engl J Med 2014;371:295-7. [CrossRef] [PubMed] 
  15. Kane J. Health costs: how the US compares with other countries. PBS Newshour. 2012. Available at: http://www.pbs.org/newshour/rundown/health-costs-how-the-us-compares-with-other-countries/ (accessed 8/4/15).
  16. Koechlin F, Lorenzoni L, Schreyer P. Comparing price levels of hospital services across countries: results of pilot study. OECD. Available at: http://www.oecd.org/officialdocuments/publicdisplaydocumentpdf/?cote=delsa/hea/wd/hwp(2010)4&doclanguage=en (accessed 8/4/15).
  17. Himmelstein D, Woolhandler S. The post-launch problem: the affordable care act’s persistently high administrative costs. May 27, 2015. Available at: http://healthaffairs.org/blog/2015/05/27/the-post-launch-problem-the-affordable-care-acts-persistently-high-administrative-costs/#table
  18. Robbins RA. Capture market share, raise prices. Southwest J Pulm Crit Care. 2015;11(2):88-9. [CrossRef]
  19. Wang E, Gee G. Larger Issuers, larger premium increases: health insurance issuer competition post-aca. Technology Science. 2015081104. August 11, 2015. Available at: http://techscience.org/a/2015081104 (accessed 8/31/15).
  20. Colemen K, Gleeson J. Cheapest healthcare provider-owned insurance plans still 12% more expensive than cheapest insurance plans not owned by providers. HealthPocket. August 20, 2015. Available at: https://www.healthpocket.com/healthcare-research/infostat/fee-for-service-and-provider-health-plans#.VeRqLPlVhBd (accessed 8/31/15).
  21. US Department of Commerce. Pharmaceutical price controls in OECD countries: implications for U.S. Consumers, pricing, research and development, and innovation. 2004. Available at: http://www.ita.doc.gov/td/chemicals/drugpricingstudy.pdf (accessed 8/31/2015).
  22. Himmelstein D, Woolhandler S. The post-launch problem: the affordable care act’s persistently high administrative costs. Health Affairs Blog. 5/27/2015. Available at: http://healthaffairs.org/blog/2015/05/27/the-post-launch-problem-the-affordable-care-acts-persistently-high-administrative-costs/ (accessed 8/31/15).

Cite as: Robbins RA. National health expenditures: the past, present, future and solutions. Southwest J Pulm Crit Care. 2015;11(4):176-85. doi: http://dx.doi.org/10.13175/swjpcc105-15 PDF