Search Journal-type in search term and press enter
Southwest Pulmonary and Critical Care Fellowships
In Memoriam

 Editorials

Last 50 Editorials

(Click on title to be directed to posting, most recent listed first)

Hospitals, Aviation and Business
Healthcare Labor Unions-Has the Time Come?
Who Should Control Healthcare? 
Book Review: One Hundred Prayers: God's answer to prayer in a COVID
   ICU
One Example of Healthcare Misinformation
Doctor and Nurse Replacement
Combating Physician Moral Injury Requires a Change in Healthcare
   Governance
How Much Should Healthcare CEO’s, Physicians and Nurses Be Paid?
Improving Quality in Healthcare 
Not All Dying Patients Are the Same
Medical School Faculty Have Been Propping Up Academic Medical
Centers, But Now Its Squeezing Their Education and Research
   Bottom Lines
Deciding the Future of Healthcare Leadership: A Call for Undergraduate
and Graduate Healthcare Administration Education
Time for a Change in Hospital Governance
Refunds If a Drug Doesn’t Work
Arizona Thoracic Society Supports Mandatory Vaccination of Healthcare
   Workers
Combating Morale Injury Caused by the COVID-19 Pandemic
The Best Laid Plans of Mice and Men
Clinical Care of COVID-19 Patients in a Front-line ICU
Why My Experience as a Patient Led Me to Join Osler’s Alliance
Correct Scoring of Hypopneas in Obstructive Sleep Apnea Reduces
   Cardiovascular Morbidity
Trump’s COVID-19 Case Exposes Inequalities in the Healthcare System
Lack of Natural Scientific Ability
What the COVID-19 Pandemic Should Teach Us
Improving Testing for COVID-19 for the Rural Southwestern American Indian
   Tribes
Does the BCG Vaccine Offer Any Protection Against Coronavirus Disease
   2019?
2020 International Year of the Nurse and Midwife and International Nurses’
   Day
Who Should be Leading Healthcare for the COVID-19 Pandemic?
Why Complexity Persists in Medicine
Fatiga de enfermeras, el sueño y la salud, y garantizar la seguridad del
   paciente y del publico: Unir dos idiomas (Also in English)
CMS Rule Would Kick “Problematic” Doctors Out of Medicare/Medicaid
Not-For-Profit Price Gouging
Some Clinics Are More Equal than Others
Blue Shield of California Announces Help for Independent Doctors-A
   Warning
Medicare for All-Good Idea or Political Death?
What Will Happen with the Generic Drug Companies’ Lawsuit: Lessons from
   the Tobacco Settlement
The Implications of Increasing Physician Hospital Employment
More Medical Science and Less Advertising
The Need for Improved ICU Severity Scoring
A Labor Day Warning
Keep Your Politics Out of My Practice
The Highest Paid Clerk
The VA Mission Act: Funding to Fail?
What the Supreme Court Ruling on Binding Arbitration May Mean to
   Healthcare 
Kiss Up, Kick Down in Medicine 
What Does Shulkin’s Firing Mean for the VA? 
Guns, Suicide, COPD and Sleep
The Dangerous Airway: Reframing Airway Management in the Critically Ill 
Linking Performance Incentives to Ethical Practice 
Brenda Fitzgerald, Conflict of Interest and Physician Leadership 
Seven Words You Can Never Say at HHS


For complete editorial listings click here.

The Southwest Journal of Pulmonary and Critical Care welcomes submission of editorials on journal content or issues relevant to the pulmonary, critical care or sleep medicine. Authors are urged to contact the editor before submission.

---------------------------------------------------------------------------------------------

Entries in outcomes (8)

Friday
Jan132023

Improving Quality in Healthcare

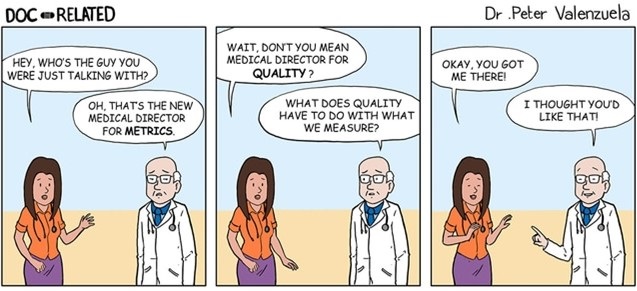
Figure 1. Dr. Katz is a little jaded about quality metrics (1).

Everyone is in favor of quality healthcare and improving it. However, to date, initially highly touted quality measures prove to be meaningless metrics in about 5-10 years. That is, when the measures are scientifically studied, they are found to be of little worth. The cycle is then repeated, i.e., new and highly touted measures are again selected and found to be useless in 5-10 years. The latest in this cycle may be the Centers for Medicare and Medicaid’s (CMS) Merit-based Incentive Payment System (MIPS). The theory underlying MIPS has been that paying for quality rather than quantity will incentivize healthcare providers to improve quality. As part of the deal creating the Affordable Care Act (Obamacare) MIPS was established as a pay for performance system which promised to improve healthcare while reducing costs. However, healthcare costs have continued to rise (2). Data on improvement in quality has been lacking.

Now, Bond et al. (3) have reported a study suggesting that MIPS incentivization of quality improvement in healthcare quality has questionable benefits. Among US primary care physicians in 2019, MIPS scores were inconsistently associated with performance on process and outcome measures. Bond’s study included 3.4 million patients attributed to 80,246 primary care physicians. Physicians were divided into thirds based on their MIPS score. Compared with physicians with high MIPS scores, physicians with the lowest MIPS scores had significantly worse mean performance on 3 of 5 process measures: diabetic eye examinations, diabetic HbA1c screening and mammography screening, but significantly better mean performance on rates of influenza vaccination and tobacco screening. MIPS scores were inconsistently associated with risk-adjusted patient outcomes: compared with physicians with the highest MIPS scores, physicians with the lowest MIPS scores had significantly better mean performance on emergency department visits per 1000 patients but worse performance on all-cause hospitalizations, and did not have significantly different performance on 4 ambulatory care-sensitive admission outcomes. Nineteen percent of physicians with the lowest MIPS scores had composite outcomes performance in the top quintile, while 21% of physicians with the highest MIPS scores had outcomes in the bottom quintile. These findings suggest that the MIPS program may be ineffective at measuring and incentivizing quality improvement among US physicians.

It is unclear why improvement  in intermediate surrogate markers is used rather than improvement in outcomes. Bond’s study measured MIPS scores against ER visits and hospitalizations. Patients, providers, insurers, bureaucrats, politicians, taxpayers- in other words, nearly everyone- would agree that reductions in ER visits and hospitalizations is desirable if it can be accomplished without patient harm. Similarly, reduction in unexpected deaths and improvement in patients’ feeling of well being are goals that all can support. However, the goals of healthcare are different depending on which population is asked. Patients might support their well-being, insurance cost, and provider access as being most important, whereas payors might support costs as most important. Providers might support efficiency of care and reimbursement as important. So ultimately what surrogate markers like MIPS do is choose one point of view which often does not affect outcomes (4).

There are many ways to achieve a goal depending on expertise, resources and patient characteristics. Flexibility in care allows the person most likely to understand the efficiencies of their particular system- the providers- to use their local knowledge to benefit the patients. Outside influences emphasizing surrogate markers, cost, or politics have historically failed. Unless one is willing to accept healthcare shown not to benefit patients as acceptable, MIPS should be eliminated. Replacing MIPS with an equally flawed system set of surrogate markers will likely not help.

It seems that outcome measures offer several advantages over process measures. Outcome measures include unexpected mortality, hospital readmissions, safety of care, effectiveness of care, timeliness of care, efficiency of care, and patient well-being (5). These are all thought to be important by patients, insurers, providers and even politicians. In my view, the process leading to these ultimate outcome goals is less important and the process producing the same or similar results will likely vary between providers and hospitals.

CMS should refocus their quality efforts on outcomes rather than processes which have failed as quality indicators. Physicians must decide whether they wish to continue participation in systems such as MIPS and the accompanying increase in paperwork. Unless something changes the trends of increasing paperwork over meaningless metrics will continue.

Richard A. Robbins MD

Editor, SWJPCCS

References

  1. Lehmann C. Comics for Docs: Medical Cartoons Poke Fun at Today's Practices. Medscape. July 15, 2022. Available at: https://www.medscape.com/slideshow/medical-cartoons-6015473#2 (accessed (1/12/23).
  2. Kurani N, Ortaliza J, Wager E, Fox L, Amin K. How Has U.S. Spending on Healthcare Changed Over Time? Peterson-KFF Health System Trasecker. February 25, 2022. Available at: https://www.healthsystemtracker.org/chart-collection/u-s-spending-healthcare-changed- time/#Total%20national%20health%20expenditures,%20US%20$%20Billions,%201970-2020 (Accessed 1/4/23).
  3. Bond AM, Schpero WL, Casalino LP, Zhang M, Khullar D. Association Between Individual Primary Care Physician Merit-based Incentive Payment System Score and Measures of Process and Patient Outcomes. JAMA. 2022 Dec 6;328(21):2136-2146. [CrossRef] [PubMed]
  4. Robbins RA, Thomas AR, Raschke RA. Guidelines, recommendations and improvement in healthcare. Southwest J Pulm Crit Care. 2011;2:34-37.
  5. Tinker A. The Top Seven Healthcare Outcome Measures and Three Measurement Essentials. Health Catalyst. June 29, 2022. Available at: https://www.healthcatalyst.com/insights/top-7-healthcare-outcome-measures (accessed 1/5/23).

Cite as: Robbins RA. Improving Quality in Healthcare. Southwest J Pulm Crit Care Sleep. 2023;26(1):8-10. doi: https://doi.org/10.13175/swjpccs002-23 PDF

Friday
Jul262019

Medicare for All-Good Idea or Political Death?

Several Democratic presidential candidates have pushed the idea of “Medicare for All” and a “Medicare for All” bill has been introduced into the US house with over 100 sponsors. A recent Medpage Today editorial by Milton Packer asks whether this will benefit patients or physicians (1). Below are our views on “Medicare for All” with the caveat that we do not speak for the American Thoracic Society nor any of its chapters.

It has been repeatedly pointed out that medical care in the US costs too much. US health care spending grew 3.9 percent in 2017, reaching $3.5 trillion or $10,739 per person, and 17.9% of the gross domestic product (GDP) (2). This is more than any industrialized country. Furthermore, our expenditures continue to rise faster than most other comparable countries such as Japan, Germany, England, Australia and Canada (2).

Despite the high costs, the US does not provide access to healthcare for all of its citizens. In 2017, 8.8 percent of people, or 28.5 million, did not have health insurance at any point during the year (3). In contrast, other comparable industrialized countries provide at least some care for everyone.

Furthermore, our outcomes are worse. Infant mortality is higher than any similar country (4). US life expectancy is shorter at 78.6 years compared to just about any comparable industrialized company with Japan leading the way at 84.1 years. All the Western European countries (such as Germany, France, England, etc.), as well as Australia and Canada have a longer life expectancy than the US (range 81.8-83.7 years).

Our high infant mortality and lagging life expectancy was not always so. In 1980, the US had similar infant mortality and life expectancy when compared to other industrialized countries. Why did we lose ground over the last 40 years? Beginning in about 1980, there have been increasing business pressures on our healthcare system. In his editorial, Packer called our system "financialized" to an extreme (1). Hospitals, pharmaceutical and device companies, insurance companies, pharmacies and sadly,  even some physicians often price their products and services not according to what is fair or good for patients but to maximize profit. By incentivizing procedures that often do not benefit patients but benefit the businessmen’s’ pockets, these practices likely account for the high costs and for our worsening outcomes.

Packer points out that in the US, intermediaries (insurers and pharmacy benefit managers) exert considerable control of payment while unnecessarily adding to the administrative costs of healthcare. Congress has been pressured to forbid Medicare from negotiating prices with pharmaceutical companies benefitting only the drug manufacturers and those that benefit from the high drug prices. Consequently, administrative costs are four times higher and pharmaceuticals three times greater in the U.S. than in other countries.

If “Medicare for All” could reduce healthcare costs and improve outcomes, it might seem like a good idea. It has the potential for reducing administrative costs and assuming the power to negotiate drug prices was restored, pharmaceutical costs. However, it will be opposed by those who financially benefit from the present system including administrators, hospitals, pharmaceutical companies, pharmacy benefit managers, insurance companies, etc. Furthermore, there is a libertarian segment of the population that opposes any Government interference in healthcare, even those that would strengthen the free market principles that so many libertarians tout. There are already TV adds opposing “Medicare for All.” It seems likely that any “Medicare for All” or any similar plan will meet with considerable political opposition. 

One solution might be to have both Government and non-Government plans. Assuming transparency in both services covered and costs, it leaves the choice in healthcare plans where it belongs-with those paying for the care. It also makes it much harder for those with financial or political interests to convincingly argue against a Government plan (although we are sure they will try). It will force insurance companies to reduce their prices and/or offer more coverage, which is not a bad thing for patients and ultimately, the healthcare system as a whole. However, it does impose a risk, i.e., that profit-driven insurance companies and those who benefit from the current infrastructure will be  replaced by bureaucrats who are primarily concerned with administrative procedure rather than patient care. Present day examples include the VA, Medicare and Medicaid systems. Close public and medical oversight of such a system would be needed.

Ideally, a healthcare system should ensure that citizens can access at least a basic level of health services without incurring financial hardship and with the goal of improving health outcomes. Such a system, would provide a middle path between the extremes of paying for nothing and paying for everything such as unwarranted chemotherapy, stem cell therapy, or unnecessary diagnostic procedures. Determining what services are covered, and how much of the cost is covered are not easy questions to answer, but promises to deliver better health for less money than our current system. Physicians, by dint of their training, and responsibility to uphold their profession and protect their patients, understand that healthcare is not a mere commodity. If we are to protect what little autonomy we have left, we need to be a part of the discussion which should not be driven solely by those in the insurance, the hospital and the pharmaceutical industries.

Richard A. Robbins, MD1

Angela C. Wang, MD2

1Phoenix Pulmonary and Critical Care Research and Education Foundation, Gilbert, AZ USA

2Scripps Clinic Torrey Pines, La Jolla, CA USA

References

  1. Packer M. Medicare for All: Would Patients and Physicians Benefit or Lose? Medpage Today. July 10, 2019. Available at: https://www.medpagetoday.com/blogs/revolutionandrevelation/80926?xid=nl_mpt_blog2019-07-10&eun=g1127723d0r&utm_source=Sailthru&utm_medium=email&utm_campaign=Packer_071019&utm_term=NL_Gen_Int_Milton_Packer (accessed 7/10/19).
  2. CMS. National Healthcare Expenditure Data. Available at: https://www.cms.gov/research-statistics-data-and-systems/statistics-trends-and-reports/nationalhealthexpenddata/nationalhealthaccountshistorical.html (accessed 7/11/19).
  3. Berchick ER, Hood E, Barnett JC. Health Insurance Coverage in the United States: 2017. September 12, 2018. United States Census Bureau Report Number P60-264. Available at: https://www.census.gov/library/publications/2018/demo/p60-264.html (accessed 7/11/19).
  4. Gonzales S,  Sawyer  B.  How does infant mortality in the U.S. compare to other countries? Peterson-Kaiser Health System Tracker. July 7, 2017. Available at: https://www.healthsystemtracker.org/chart-collection/infant-mortality-u-s-compare-countries/#item-start (accessed 7/11/19).
  5. Gonzales S, Ramirez M, Sawyer B.  How does U.S. life expectancy compare to other countries? Peterson-Kaiser Health System Tracker. April 4, 2019. Available at: https://www.healthsystemtracker.org/chart-collection/u-s-life-expectancy-compare-countries/#item-start (accessed 7/11/19).

Cite as: Robbins RA, Wang AC. Medicare for all-good idea or political death? Southwest J Pulm Crit Care. 2019;19(1):18-20. doi: https://doi.org/10.13175/swjpcc051-19 PDF

Saturday
Dec122015

CMS Penalizes 758 Hospitals for Safety Incidents 

The Centers for Medicare and Medicaid Services (CMS) is penalizing 758 hospitals with higher rates of patient safety incidents, and more than half of those were also fined last year, as reported by Kaiser Health News (1).

Among the hospitals being financially punished are some well-known institutions, including Yale New Haven Hospital, Medstar Washington Hospital Center in DC, Grady Memorial Hospital, Northwestern Memorial Hospital in Chicago, Indiana University Health,  Brigham and Womens Hospital, Tufts Medical Center, University of North Carolina Hospital, the Cleveland Clinic, Hospital of the University of Pennsylvania, Parkland Health and Hospital, and the University of Virginia Medical Center (Complete List of Hospitals Penalized 2016). In the Southwest the list includes Banner University Medical Center in Tucson, Ronald Reagan UCLA Medical Center, Stanford Health Care, Denver Health Medical Center and the University of New Mexico Medical Center (for list of Southwest hospitals see Appendix 1). In total, CMS estimates the penalties will cost hospitals $364 million. Look now if you must, but you might want to read the below before on how to interpret the data.

The penalties, created by the 2010 health law, are the toughest sanctions CMS has taken on hospital safety. Patient safety advocates worry the fines are not large enough to alter hospital behavior and that they only examine a small portion of the types of mistakes that take place. On the other hand, hospitals say the penalties are counterproductive and unfairly levied against places that have made progress in safety but have not caught up to most facilities. They are also bothered that the health law requires CMS to punish a quarter of hospitals each year. CMS plans to add more types of conditions in future years.

I would like to raise two additional concerns. First, is the data accurate? The data is self-reported by the hospitals and previously the accuracy of these self reports has been questioned (2). Are some hospitals being punished for accurately reporting data while others rewarded for lying? I doubt that CMS will be looking too closely since bad data would invalidate their claims that they are improving hospital safety. It seems unlikely that punishing half the Nation's hospitals will do much except encouraging more suspect data.

Second, does the data mean anything? Please do not misconstrue or twist the truth that I am advocating against patient safety. What I am advocating for is meaningful measures. Previous research has suggested that the measures chosen by CMS have no correlation or even a negative correlation with patient outcomes (3,4). In other words, doing well on a safety measure was associated with either no improvement or a negative outcome, in some cases even death. How can this be? Let me draw an analogy of hospital admissions. About 1% of the 35 million or so patients admitted to hospitals in the US die. The death rate is much lower in the population not admitted to the hospital. According to CMS' logic, if we were to reduce admissions by 5% or 1.75 million, 17,500 lives (1% of 1.75 million) would be saved. This is, of course, absurd.

Looking at hospital acquired infections which make up much of CMS' data, CMS' logic appears similar. For example, insertion of urinary catheters, large bore central lines or endotracheal intubation in sick patients is common. The downside is some will develop urinary, line or lung infections as a complication of these insertions. Many of these sick patients will die and many will have line infections. The data is usually reported by saying hospital-acquired infections have decreased saving 50,000 lives and saved $12 billion in care costs (5). However, the truth is that hospital-acquired infections are often either not the cause of death or the final event in a disease process that caused the patient to be admitted to the hospital in the first place. If 50,000 lives are saved that should be reflected in the hospital death rates or a savings on insurance premiums. Neither has been shown to my knowledge.

So look at the data if you must but look with a skeptical eye. Until CMS convincingly demonstrates that the data is accurate and that their incentives decrease in-hospital complications, mortality and costs-the data is suspect. It could be as simple that the hospitals receiving the penalties are those taking care of sicker patients. What this means is that some hospitals, perhaps the ones that need the money the most, will have 1% less CMS reimbursement, which might make care worse rather than better.

Richard A. Robbins, MD

Editor

SWJPCC

References

  1. Rau J. Medicare penalizes 758 hospitals for safety incidents, Kaiser Health News. December 10, 2015. Available at: http://khn.org/news/medicare-penalizes-758-hospitals-for-safety-incidents/ (accessed 12/11/15).
  2. Robbins RA. The Emperor has no clothes: the accuracy of hospital performance data. Southwest J Pulm Crit Care 2012;5:203-5.
  3. Robbins RA, Gerkin RD. Comparisons between Medicare mortality, morbidity, readmission and complications. Southwest J Pulm Crit Care. 2013;6(6):278-86
  4. Lee GM, Kleinman K, Soumerai SB, et al. Effect of nonpayment for preventable infections in U.S. hospitals. N Engl J Med. 2012;367(15):1428-37. [CrossRef] [PubMed]
  5. Department of Health and Human Services. Efforts to improve patient safety result in 1.3 million fewer patient harms, 50,000 lives saved and $12 billion in health spending avoided. December 2, 2014. Available at: http://www.hhs.gov/about/news/2014/12/02/efforts-improve-patient-safety-result-1-3-million-fewer-patient-harms-50000-lives-saved-and-12-billion-in-health-spending-avoided.html (accessed 12/11/15).

Cite as: Robbins RA. CMS penalizes 758 hospitals for safety incidents. Southwest J Pulm Crit Care. 2015;11(6):269-70. doi: http://dx.doi.org/10.13175/swjpcc153-15 PDF

Tuesday
Jan062015

The Hands of a Healer 

The article in this month’s SWJPCC - "Physical Examination in the Intensive Care Unit. Opinions of Physicians at Three Teaching Hospitals" (1), is a fascinating insight to medical practice and how it has changed with the advent of new technology. The study at three large teaching facilities addressed the questions of how often a physical exam was performed in the ICU, what the perceived utility of the physical exam was, who examines patients most,  and an interesting question pertaining to what exactly constitutes a physical exam. Participants were given theoretical scenarios and answered questions pertaining to the role of a physical exam.  Even though the format was a questionnaire and not direct observation, the results support what I see in clinical practice. The results show that the physical exam, at least in the ICU, is not deemed a critical tool in our armamentarium and that reliance on technology has supplanted the traditional exam. One point that has yet to be formally addressed by this or other studies, is actually how often the physical exam changes the clinical course.

Those of us in my generation remember the days when physical exam was paramount. Indeed, when I was in medical school in England, it was essential and when we presented cases, we had to make a differential diagnosis solely based on the history and physical exam, and then, and only then, would we order specific tests. That was about 25 years ago in London. I suspect that many of my colleagues from that era or earlier, had similar experiences. Modern US practice is to use the physical exam, order a battery of tests and imaging, then come up with the diagnosis.  It has not been shown unequivocally that our reliance on modern imaging and labs is necessarily better.

There are still some scenarios that no laboratory test can pick up. Even in pulmonary medicine, we still teach to treat the patient, not the ABG; and the diagnosis of respiratory failure does not require anything other than a look at the patient. Wheezing shows up on no commonly use lab or imaging in the ICU (excluding less commonly used techniques such as measurement of respiratory system resistance using the ventilator’s sensors and algorithms). There is no question that modern testing is more accurate and provides much more information to us than any, even Oslerian levels of clinical examination could. It also leads to work ups for incidentalomas that may have no real relevance. Conversely all of us probably have anecdotal stories of an exam changing the course. For example, I recall the physical exam that picked the cause of the patient’s agitation, an ulcer on the back of a ventilated, heavily sedated patient. This led to less use of benzodiazepines and a focus on pain control perhaps preventing or mitigating the clinical detriments of excess sedative use in the ICU.

Ordering tests and imaging is usually quicker for the MD than doing a physical exam – one can order three CT scans on three patients in less time than it takes to physically go and exam three patients. This is clearly an improved efficiency for the MD’s work load. The question is then whether the improved efficiency for the MD and added information about the patient from the ancillary testing is worth the extra cost. The physical exam is free except insofar as the time it takes and the effect this has on billing, i.e. that it is still a necessary part of the billing matrix.

The nature of what is a physical exam is also changing. Incorporating bedside imaging with ultrasound is no more a stretch than was incorporating the auscultatory findings when the stethoscope was first introduced. Palpation and percussion in this study, were not deemed necessary parts of the physical exam, which is in sharp contrast the traditional teaching. The perception amongst US physicians that physical exam is more utilized outside the US (England being a typical example) may or may not be true. From the results of this particular study, it seems not to be the case, as there was no difference in responses amongst those who had medical school training outside the US. However even currently, it is impossible to progress in England to higher postgraduate training MRCP or FRCP (member or fellow of the Royal College of Physicians) without being grilled on a physical exam (2).

So where then is the correct balance? As the authors point out, the classic physical findings we were taught are usually present in extreme or end stage disease whereas our purportedly better technology now finds these processes earlier in the clinical course. Pure reliance on either the physical exam or the ancillary testing is not likely to be the correct approach. The answer has yet to be ascertained. A study addressing how often the clinical exam changes the course of a patient’s care significantly (however one may define this) has yet to be done. My prediction is that within 20-30 years, the physical exam will be almost never done in clinical practice.

Clement U. Singarajah, MD

Associate Editor

Southwest Journal of Pulmonary and Critical Care

References

  1. Vazquez R, Vazquez Guillamet C, Adeel Rishi M, Florindez J, Dhawan PS, Allen SE, Manthous CA, Lighthall G.  Physical examination in the intensive care unit: opinions of physicians at three teaching hospitals. Southwest J Pulm Crit Care. 2015;10(1):34-43. [CrossRef]
  2. Royal College of Physicians of the United Kingdom. MRCP(UK) part 2 clinical examination (paces) guide notes for candidates 2014. Available at: http://www.mrcpuk.org/sites/default/files/documents/Candidate%20guide%20notes%202014_1.pdf (accessed 1/6/15).

Reference as: Singarajah CU. The hands of a healer. Southwest J Pulm Crit Care. 2015;10(1):32-3. doi: http://dx.doi.org/10.13175/swjpcc002-15 PDF

Friday
Jul252014

Mild Obstructive Sleep Apnea: Beyond the AHI 

Joyce Lee-Iannotti MD

James M Parish MD

Division of Pulmonary Medicine (Dr Parish) Center for Sleep Medicine Department of Neurology (Dr Lee-Iannotti), Center for Sleep Medicine

Mayo Clinic Arizona

Scottsdale, Arizona

A common conundrum faced by sleep medicine practitioners is how to manage the large group of patients with mild sleep apnea. Many patients are referred for sleep evaluation, with symptoms thought to be due to obstructive sleep apnea (OSA). Often polysomnography demonstrates only mild sleep apnea, and the clinician and patient are faced with the dilemma of whether to use continuous positive airway pressure (CPAP) therapy or an oral appliance. In making this important decision the clinician incorporates the commonly used definition of mild sleep apnea as an apnea-hypopnea index of between 5 and 14 apneas or hypopneas per hour of sleep.  Moderate sleep apnea is defined as 15-29 events per hour, and severe is 30 and above events per hour. These arbitrary thresholds originated in the early 1980s when knowledge of this condition was in its infancy and little was known about the long term health effects. The definition was based on the finding of apneas, defined by the complete cessation of airflow for at least 10 seconds. The concept of hypopnea and respiratory-effort related arousal (RERA) came later and with frequently changing definitions that have been the subject of significant controversy throughout the last 30 years.  Many sleep centers include these RERA’s in the definition of respiratory disturbance index, which is incorrectly used interchangeably with AHI. While the sleep literature has demonstrated the untoward effects of moderate to severe sleep apnea, there has been considerable debate about the clinical significance of mild sleep apnea, that is, an AHI between 5 and 15.

The current paper by Quan, et al (1) is a significant contribution to the literature in sleep medicine addressing this important clinical question. This paper reports data drawn from the APPLES study, a large multi-center, well-conducted study designed to determine if CPAP therapy improves sleepiness, mood disorder, or cognitive function in patients with OSA, that has subsequently produced several important publications (2-6). As part of the study, extensive data was obtained on each of these neurocognitive parameters including the Epworth Sleepiness Scale, Stanford Sleepiness Scale, Hamilton Rating Scale for Depression, Profile of Mood States, and Sleep Apnea Quality of Life Index, all validated questionnaires used frequently in the sleep literature. In this part of the study, 199 patients with an AHI>5 but <15 were compared to 40 patients enrolled in the study, but with and AHI<5. The mean AHI was 10 per hour in the mild OSA group, and was 3 per hour in the non-OSA group.  Size of the study was statistically large enough to determine significant differences. Remarkably, there was no significant difference in any rating of sleepiness, mood, or quality of life between the two groups. This study produces an important challenge to the traditional thresholds of disease severity, and raises the question of whether mild sleep apnea based on AHI alone is a disease, and whether it truly requires treatment. Since many patients seen at sleep medicine clinics fall into this category, this is an extremely important question to address.

Several previous studies have attempted to elucidate the issue of mild sleep apnea. Barnes, et al (7) in a randomized controlled trial of CPAP in mild OSA (defined in their study as an AHI 5-30 events per hour) reported that CPAP improved self-reported symptoms of snoring, restless sleep, daytime sleepiness, and irritability, but did not improve objective measure of sleepiness (multiple sleep latency test) or any test of neurobehavioral function, quality of life, mood scores, or 24-hour blood pressure. Weaver, et al (8) reported results from the CATNAP study, a randomized, sham-CPAP controlled study of self reported sleepy patients with mild OSA (defined as AHI 5-30 events per hour) that CPAP significantly improved scores on the Functional Outcomes of Sleep Questionnaire. Both of these trials differ from the current study by defining mild OSA as an AHI up to 30 per hour, whereas the major controversy involves those patients in the AHI 5-15 range. The CATNAP study also selected patients who complained of excessive sleepiness.

The findings from this study emphasize the need to differentiate “obstructive sleep apnea” from “obstructive sleep apnea syndrome.”  Obstructive sleep apnea has been traditionally defined solely by the AHI, whereas OSA syndrome incorporates the subjective and clinical components to the diagnosis (sleepiness, mood disturbance, fatigue, etc.) An abnormal AHI in the mild range without symptoms may not warrant  treatment with CPAP, whereas an excessively sleepy patient with an AHI of 7 would require at least a trial of CPAP with close monitoring. Fatigue, although traditionally associated with mood disorders, is a common symptom in sleep medicine and may be a manifestation of untreated sleep apnea. Future studies could incorporate a fatigue scale (e.g. Fatigue Severity Score) as an adjunct to the Epworth sleepiness score to assess the importance of fatigue as a symptom of OSA.

The current study has an important limitation in that subjects were enrolled based on a referral to a sleep center for some clinical indication related to OSA, and therefore do not represent the general population. It would be possible that individuals drawn randomly from the general population would have lower scores on these tests than a group of subjects referred to a sleep center, which would result in the mild OSA group having significantly different scores on these tests than the general population. In addition the no-OSA group in this study included only 40 patients, and it is possible that a larger group of true no-OSA patients without symptoms causing referral to a sleep center would yield a slightly different result. However, if the untoward effects of mild OSA are indeed significant, it should be relatively easy to find significant abnormalities in mood, sleepiness, and quality of life, and the inability to demonstrate differences in this study group leads one to conclude that the differences, if they exist, are likely to very small.

Besides the mood and quality of life effects of sleep apnea, cardiovascular disease is known to be a significant consequence of obstructive sleep apnea (9).  Stroke, heart failure, myocardial infarction, and atrial fibrillation are known to occur more commonly in untreated OSA than in normal individuals (10). There have been several studies on the cardiovascular effects of mild sleep apnea. The Sleep Heart Health study found a small but significant increase in cardiovascular disease in mild sleep apnea (11).  In another study, Buchner et al (12) found CPAP reduced the risk of subsequent cardiovascular events in patients with mild to moderate (AHI 5-30 per hour) OSA. Therefore, the clinician must look at not only at the AHI, but the larger picture inclusive of presenting symptoms and cardiovascular and cerebrovascular risk factors when deciding on treatment.

Ultimately, this paper challenges the sleep community to look beyond the AHI and improve management algorithms for patients with mild obstructive sleep apnea, with or without symptoms. We propose that an obstructive sleep apnea score be developed, similar to the CHADS-2 score used to determine the need for anticoagulation in patients with non-valvular atrial fibrillation as a means of secondary stroke prevention (13). The “OSA score” could incorporate the AHI, the Epworth sleepiness scale, a quality of life score, a fatigue severity scale, and known cardiovascular and cerebrovascular co-morbidities. A point system could be generated to determine the need for CPAP or alternative therapies.

Hence, this study is likely to be a sentinel study in the sleep medicine literature. Further research in how to “score” patients who need treatment is needed in order to provide best value in management of sleep apnea.

References

  1. Quan SF, Budhiraja R, Batool-Anwar S, Gottlieb DJ, Eichling P, Patel S, Wei Shen, Walsh JK, Kushida CA. Lack of impact of mild obstructive sleep apnea on sleepiness, mood and quality of life. Southwest J Pulm Crit Care. 2014;9(1):44-56. [CrossRef]
  2. Kushida CA, Nichols DA, Quan SF, et al. The Apnea Positive Pressure Long-term Efficacy Study (APPLES): rationale, design, methods, and procedures. J Clin Sleep Med 2006;2(3):288-300. [PubMed] 
  3. Quan SF, Chan CS, Dement WC, et al. The association between obstructive sleep apnea and neurocognitive performance--the Apnea Positive Pressure Long-term Efficacy Study (APPLES). Sleep 2011;34(3):303-14B. [PubMed]
  4. Kushida CA, Nichols DA, Holmes TH, et al. Effects of continuous positive airway pressure on neurocognitive function in obstructive sleep apnea patients: The Apnea Positive Pressure Long-term Efficacy Study (APPLES). Sleep 2012;35(12):1593-602. [PubMed]
  5. Quan SF, Budhiraja R, Clarke DP, et al. Impact of treatment with continuous positive airway pressure (CPAP) on weight in obstructive sleep apnea. J Clin Sleep Med. 2013;9(10):989-93. [PubMed]
  6. Batool-Anwar S, Goodwin JL, Drescher AA, et al. Impact of CPAP on activity patterns and diet in patients with obstructive sleep apnea (OSA). J Clin Sleep Med. 2014;10(5):465-72. [PubMed] 
  7. Barnes M, Houston D, Worsnop CJ, et al. A randomized controlled trial of continuous positive airway pressure in mild obstructive sleep apnea. Am J Resp Crit Care Med. 2002;165(6):773-80. [CrossRef] [PubMed] 
  8. Weaver TE, Mancini C, Maislin G, et al. Continuous positive airway pressure treatment of sleepy patients with milder obstructive sleep apnea: results of the CPAP Apnea Trial North American Program (CATNAP) randomized clinical trial. Am J Respir Crit Care Med 2012;186(7):677-83. [CrossRef] [PubMed]
  9. Newman AB, Nieto FJ, Guidry U, et al. Relation of sleep-disordered breathing to cardiovascular disease risk factors: the Sleep Heart Health Study. Am J Epidemiol. 2001;154(1):50-9. [CrossRef] [PubMed] 
  10. Somers VK, White DP, Amin R, et al. Sleep Apnea and Cardiovascular Disease: An American Heart Association/American College of Cardiology Foundation Scientific Statement From the American Heart Association Council for High Blood Pressure Research Professional Education Committee, Council on Clinical Cardiology, Stroke Council, and Council on Cardiovascular Nursing In Collaboration With the National Heart, Lung, and Blood Institute National Center on Sleep Disorders Research (National Institutes of Health). J Am Coll Cardiol. 2008;52(8):686-717. [CrossRef] [PubMed] 
  11. Shahar E, Whitney C, Redline S, et al. Sleep-disordered breathing and cardiovascular disease: cross-sectional results of the Sleep Heart Health Study. Am J Respir Crit Care Med 2001;163:19-25. [CrossRef] [PubMed] 
  12. Buchner NJ, Sanner BM, Borgel J, Rump LC. Continuous Positive Airway Pressure Treatment of Mild to Moderate Obstructive Sleep Apnea Reduces Cardiovascular Risk. Am J Resp Crit Care Med. 2007;176(12):1274-80. [CrossRef] [PubMed] 
  13. Gage BF, Waterman AD, Shannon W, Boechler M, Rich MW, Radford MJ. Validation of clinical classification schemes for predicting stroke: results from the National Registry of Atrial Fibrillation. JAMA. 2001;285(22):2864-70. [CrossRef] [PubMed] 

Reference as: Lee-Iannotti J, Parish JM. Mild obstructive sleep apnea: beyond the AHI. Southwest J Pulm Crit Care. 2014;9(1):40-3. doi: http://dx.doi.org/10.13175/swjpcc099-14 PDF