
A Comparison Between Hospital Rankings and Outcomes Data
Richard A. Robbins, MD*
Richard D. Gerkin, MD ‡
*Phoenix Pulmonary and Critical Care Research and Education Foundation, Gilbert, AZ
‡Banner Good Samaritan Medical Center, Phoenix, AZ
Abstract
Hospital rankings have become common but the agreement between the rankings and correlation with patient-centered outcomes remains unknown. We examined the ratings of Joint Commission on Healthcare Organizations (JCAHO), Leapfrog, and US News and World Report (USNews), and outcomes from Centers for Medicare and Medicaid Hospital Compare (CMS) for agreement and correlation. There was some correlation among the three “best hospitals” ratings. There was also some correlation between “best hospitals” and CMS outcomes, but often in a negative direction. These data suggest that no one “best hospital” list identifies hospitals that consistently attain better outcomes.
Introduction
Hospital rankings are being published by a variety of organizations. These rankings are used by hospitals to market the quality of their services. Although all the rankings hope to identify “best” hospitals, they differ in methodology. Some emphasize surrogate markers; some emphasize safety, i.e., a lack of complications; some factor in the hospital’s reputation; some factor in patient-centered outcomes. However, most do not emphasize traditional outcome measures such as mortality, mortality, length of stay and readmission rates. None factor cost or expenditures on patient care.
We examined three common hospital rankings and clinical outcomes. We reasoned that if the rankings are valid then better hospitals should be consistently on these best hospital lists. In addition, better hospitals should have better outcomes.
Methods
CMS
Outcomes data was obtained from the CMS Hospital Compare website from December 2012-January 2013 (1). The CMS website presents data on three diseases, myocardial infarction (MI), congestive heart failure (CHF) and pneumonia. We examined readmissions, complications and deaths for each of these diseases. We did not examine all process of care measures since many of the measures have not been shown to correlate with improved outcomes and patient satisfaction has been shown to correlate with higher admission rates to the hospital, higher overall health care expenditures, and increased mortality (2). In some instances actual data is not presented on the CMS website but only higher, lower or no different from the National average. In this case, scoring was done 2, 0 and 1 respectively with 2=higher, 0=lower and 1=no different.
Mortality is the 30-day estimates of deaths from any cause within 30 days of a hospital admission, for patients hospitalized with one of several primary diagnoses (MI, CHF, and pneumonia). Mortality was reported regardless of whether the patient died while still in the hospital or after discharge. Similarly, the readmission rates are 30-day estimates of readmission for any cause to any acute care hospital within 30 days of discharge. The mortality and readmission measures rates were adjusted for patient characteristics including the patient’s age, gender, past medical history, and other diseases or conditions (comorbidities) the patient had at hospital arrival that are known to increase the patient’s risk of dying or readmission.
The rates of a number of complications are also listed in the CMS data base (Table 1).
Table 1. Complications examined that are listed in CMS data base.
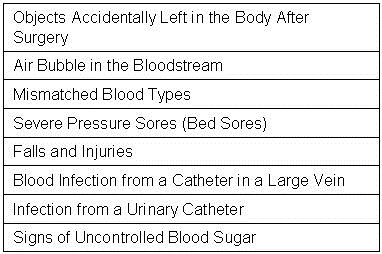
CMS calculates the rate for each serious complication by dividing the actual number of outcomes at each hospital by the number of eligible discharges for that measure at each hospital, multiplied by 1,000. The composite value reported on Hospital Compare is the weighted averages of the component indicators. The measures of serious complications reported are risk adjusted to account for differences in hospital patients’ characteristics. In addition, the rates reported on Hospital Compare are “smoothed” to reflect the fact that measures for small hospitals are measured less accurately (i.e., are less reliable) than for larger hospitals.
Similar to serious infections, CMS calculates the hospital acquired infection data from the claims hospitals submitted to Medicare. The rate for each hospital acquired infection measure is calculated by dividing the number of infections that occur within any given eligible hospital by the number of eligible Medicare discharges, multiplied by 1,000. The hospital acquired infection rates were not risk adjusted.
JCAHO
The JCAHO list of Top Performers on Key Quality Measures™ was obtained from its 2012 list (3). The Top Performers are based on an aggregation of accountability measure data reported to The JCAHO during the previous calendar year.
Leapfrog
Leapfrog’s Hospital Safety Score were obtained from their website during December 2012-January 2013 (4). The score utilizes 26 National performance measures from the Leapfrog Hospital Survey, the Agency for Healthcare Research and Quality (AHRQ), the Centers for Disease Control and Prevention (CDC), and the Centers for Medicare and Medicaid Services (CMS) to produce a single composite score that represents a hospital’s overall performance in keeping patients safe from preventable harm and medical errors. The measure set is divided into two domains: (1) Process/Structural Measures and (2) Outcome Measures. Many of the outcome measures are derived from the complications reported by CMS (Table 1). Each domain represents 50% of the Hospital Safety Score. The numerical safety score is then converted into one of five letter grades. "A" denotes the best hospital safety performance, followed in order by "B", "C", “D,” and “F.” For analysis, these letter grades were converted into numerical grades 1-5 corresponding to letter grades A-F.
US News and World Report
US News and World Report’s (USNews) 2012-3 listed 17 hospitals on their honor roll (5). The rankings are based largely on objective measures of hospital performance, such as patient survival rates, and structural resources, such as nurse staffing levels. Each hospital’s reputation, as determined by a survey of physician specialists, was also factored in the ranking methodology. The USNews top 50 cardiology and pulmonology hospitals were also examined.
Statistical Analysis
Categorical variables such as JCAHO and USNews best hospitals were compared with other data using chi-squared analysis. Spearman rank correlation was used to help determine the direction of the correlations (positive or negative). Significance was defined as p<0.05.
Results
Comparisons of Hospital Rankings between Organizations
A large database of nearly 3000 hospitals was compiled for each of the hospital ratings (Appendix 1). The “best hospitals” as rated by the JCAHO, Leapfrog and USNews were compared for correlation between the organizations (Table 2).
Table 2. Correlation of “best hospitals” between different organizations
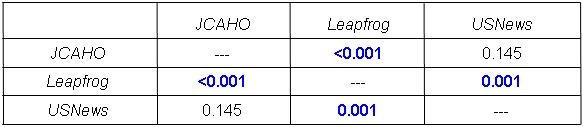
There was significant correlation between the JCAHO and Leapfrog and Leapfrog and USNews but not between JCAHO and USNews.
JCAHO-Leapfrog Comparison
The Leapfrog grades were significantly better for JCAHO “Best Hospitals” compared to hospitals not listed as “Best Hospitals” (2.26 + 0.95 vs. 1.85 + 0.91, p<0.0001). However, there were multiple exceptions. For example, of the 358 JCAHO “Best Hospitals” with a Leapfrog grade, 84 were graded “C”, 11 were graded “D” and one was graded as “F”.
JCAHO-USNews Comparison
Of the JCAHO “Top Hospitals” only one was listed on the USNews “Honor Roll”. Of the cardiology and pulmonary “Top 50” hospitals only one and two hospitals, respectively, were listed on the JCAHO “Top Hospitals” list.
Leapfrog-USNews Comparison
The Leapfrog grades of the US News “Honor Roll” hospitals did not significantly differ compared to the those hospitals not listed on the “Honor Roll” (2.21 + 0.02 vs. 1.81 + 0.31, p>0.05). However, Leapfrog grades of the US News “Top 50 Cardiology” hospitals had better Leapfrog grades (2.21 + 0.02 vs. 1.92 + 0.14, p<0.05). Similarly, Leapfrog grades of the US News “Top 50 Pulmonary” hospitals had better Leapfrog grades (2.21 + 0.02 vs. 1.91 + 0.15, p<0.05).
“Best Hospital” Mortality, Readmission and Serious Complications
The data for the comparison between the hospital rankings and CMS’ readmission rates, mortality rates and serious complications for the JCAHO, Leapfrog, and USNews are shown in Appendix 2, Appendix 3, and Appendix 4 respectively. The results of the comparison of “best hospitals” compared to hospitals not listed as best hospitals are shown in Table 3.
Table 3. Results of “best hospitals” compared to other hospitals for mortality and readmission rates for myocardial infarction (MI), congestive heart failure (CHF) and pneumonia.
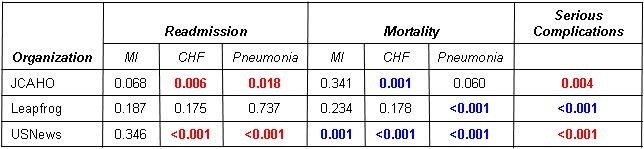
Red: Relationship is concordant (better rankings associated with better outcomes)
Blue: Relationship is discordant (better rankings associated with worse outcomes)
Note that of 21 total p values for relationships, 12 are non-significant, 6 are concordant and significant, and 6 are discordant and significant. All 4 of the significant readmission relationships are discordant. All 5 of the significant mortality relationships are concordant. This underscores the disjunction of mortality and readmission. All 3 of the relationships with serious complications are significant, but one of these is discordant. Of the 3 ranking systems, Leapfrog has the least correlation with CMS outcomes (5/7 non-significant). USNews has the best correlation with CMS outcomes (6/7 significant). However, 3 of these 6 are discordant.
The USNews “Top 50” hospitals for cardiology and pulmonology were also compared to those hospitals not listed as “Top 50” hospitals for cardiology and pulmonology. Similar to the “Honor Roll” hospitals there was a significantly higher proportion of hospitals with better mortality rates for MI and CHF for the cardiology “Top 50” and for pneumonia for the pulmonary “Top 50”. Both the cardiology and pulmonary “Top 50” had better serious complication rates (p<0.05, both comparisons, data not shown).
Discussion
Lists of hospital rankings have become widespread but whether these rankings identify better hospitals is unclear. We reasoned that if the rankings were meaningful then there should be widespread agreement between the hospital lists. We did find a level of agreement but there were exceptions. Hospital rankings should correlate with patient-centered outcomes such as mortality and readmission rates. Overall that level of agreement was low.
One probable cause accounting for the differences in hospital rankings is the differing methodologies used in determined the rankings. For example, JCAHO uses an aggregation of accountability measures. Leapfrog emphasizes safety or a lack of complications. US News uses patient survival rates, structural resources, such as nurse staffing levels, and the hospital’s reputation. However, the exact methodolgical data used to formulate the rankings is often vague, especially for JCAHO and US News rankings. Therefore, it should not be surprising that the hospital rankings differ.
Another probable cause for the differing rankings is the use of selected complications in place of patient-centered outcome measures. Complications are most meaningful when they negatively affect ultimate patient outcomes. Some complications such as objects accidentally left in the body after surgery, air bubble in the bloodstream or mismatched blood types are undesirable but very infrequent. Whether a slight, but significant, increase in these complications would increase more global measures such as morality or readmission rates is unlikely. The overall poor correlation of these outcomes with deaths and readmissions in the CMS database is consistent with this concept.
Some of the surrogate complication rates are clearly evidence-based but some are clearly not. For example, many of the central-line associated infection and ventilator-associated pneumonia guidelines used are non-evidence based (6.7). Furthermore, overreaction to correct some of the complications such as “signs of uncontrolled blood sugar” may be potentially harmful. This complication could be interpreted as tight control of the blood sugar. Unfortunately, when rigorously studied, patients with tight glucose control actually had an increase in mortality (8).
In some instances a complication was associated with improved outcomes. Although the reason for this discordant correlation is unknown, it is possible that the complication may occur as a result of better care. For example, catherization of a central vein for rapid administration of fluids, drugs, blood products, etc. may result in better outcomes or quality but will increase the central line-associated bloodstream infection rate. In contrast, not inserting a catheter when appropriate might lead to worse outcomes or poorer quality but would improve the infection rate.
Many of the rankings are based, at least in part, on complication data self-reported by the hospitals to CMS. However, the accuracy of this data has been called into question (9,10). Meddings et al. (10) studied urinary tract infections which were self-reported by hospitals using claims data. According to Meddings (10), the data were “inaccurate” and not were “not valid data sets for comparing hospital acquired catheter-associated urinary tract infection rates for the purpose of public reporting or imposing financial incentives or penalties”. The authors proposed that the nonpayment by Medicare for “reasonably preventable” hospital-acquired complications resulted in this discrepancy. Inaccurate data may lead to the lack of correlation a complication and outcomes on the CMS database.
The sole source of mortality and readmission data in this study was CMS. This is limited to Medicare and Medicaid patients but is probably representative of the general population in an acute care hospital. However, also included on the CMS website is a dizzying array of measures. We did not analyze every measure but analyzed only those listed in Table 1. Whether examination of other measures would correlate with mortality and readmission rates is unclear.
There are several limitations to our data. First and foremost, the CMS data is self-reported by hospitals. The validity and accuracy of the data has been called into question. Second, data is missing in multiple instances. For example, much of the data from Maryland was not present. Also, there were multiple instances when the data was “unavailable” or the “number of cases are too small”. Third, in some instances CMS did not report actual data but only higher, lower or no different from the National average. This loss of information may have led to inaccurate analyses. Fourth, much of the data are from surrogate markers, a fact which is important since surrogate markers have not been shown to predict outcomes. This is also puzzling since patient-centered outcomes are available. Fifth, much of the outcomes data is derived from CMS which to a large extent eliminates Veterans Administration, pediatric, mental health and some other specialty facilities.
It is unclear if any of the hospital rankings should be used by patients or healthcare providers when choosing a hospital. At present it would appear that the rankings have an over reliance on surrogate markers, many of which are weakly evidence-based. Furthermore, categorizing the data as average, below or above average may lead to an inaccurate interpretation of the data. Lastly, the accuracy of the data is unclear. Finally, lack of data on length of stay and some major morbidities is a major weakness. We as physicians need to scrutinize these measurement systems and insist on greater methodological rigor and more relevant criteria to choose. Until these shortcomings are overcome, we cannot recommend the use of hospital rankings by patients or providers.
References
- http://www.medicare.gov/hospitalcompare/ (accessed 6/12/13).
- Fenton JJ, Jerant AF, Bertakis KD, Franks P. The cost of satisfaction: a national study of patient satisfaction, health care utilization, expenditures, and mortality. Arch Intern Med. 2012;172(5):405-11. [CrossRef] [PubMed]
- http://www.jointcommission.org/annualreport.aspx (accessed 6/12/13).
- http://www.hospitalsafetyscore.org (accessed 6/12/13).
- http://health.usnews.com/best-hospitals (accessed 6/12/13).
- Padrnos L, Bui T, Pattee JJ, Whitmore EJ, Iqbal M, Lee S, Singarajah CU, Robbins RA. Analysis of overall level of evidence behind the Institute of Healthcare Improvement ventilator-associated pneumonia guidelines. Southwest J Pulm Crit Care. 2011;3:40-8.
- Hurley J, Garciaorr R, Luedy H, Jivcu C, Wissa E, Jewell J, Whiting T, Gerkin R, Singarajah CU, Robbins RA. Correlation of compliance with central line associated blood stream infection guidelines and outcomes: a review of the evidence. Southwest J Pulm Crit Care. 2012;4:163-73.
- NICE-SUGAR Study Investigators. Intensive versus conventional insulin therapy in critically ill patients. N Engl J Med. 2009;360:1283-97. [CrossRef] [Pubmed]
- Robbins RA. The emperor has no clothes: the accuracy of hospital performance data. Southwest J Pulm Crit Care. 2012;5:203-5.
- Meddings JA, Reichert H, Rogers MA, Saint S, Stephansky J, McMahon LF. Effect of nonpayment for hospital-acquired, catheter-associated urinary tract infection: a statewide analysis. Ann Intern Med. 2012;157:305-12. [CrossRef] [PubMed]
Reference as: Robbins RA, Gerkin RD. A comparison between hospital rankings and outcomes data. Southwest J Pulm Crit Care. 2013;7(3):196-203. doi: http://dx.doi.org/10.13175/swjpcc076-13 PDF
 Rick Robbins, M.D.